Intro: From Pain to Product
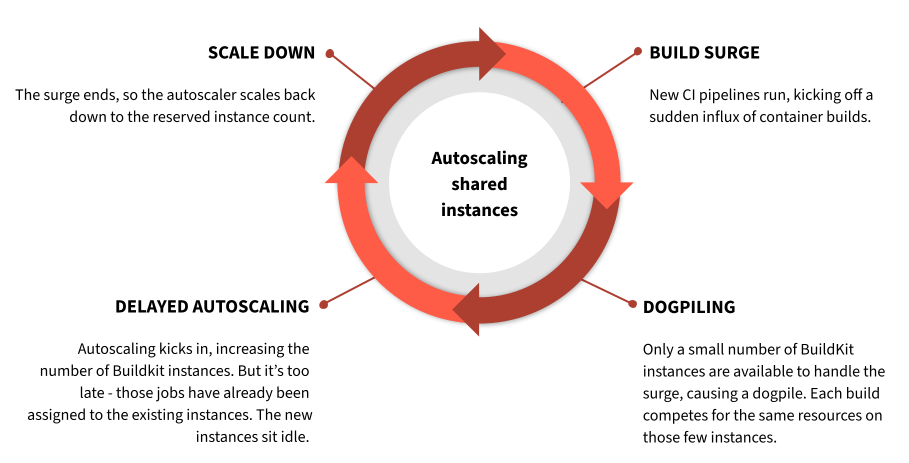
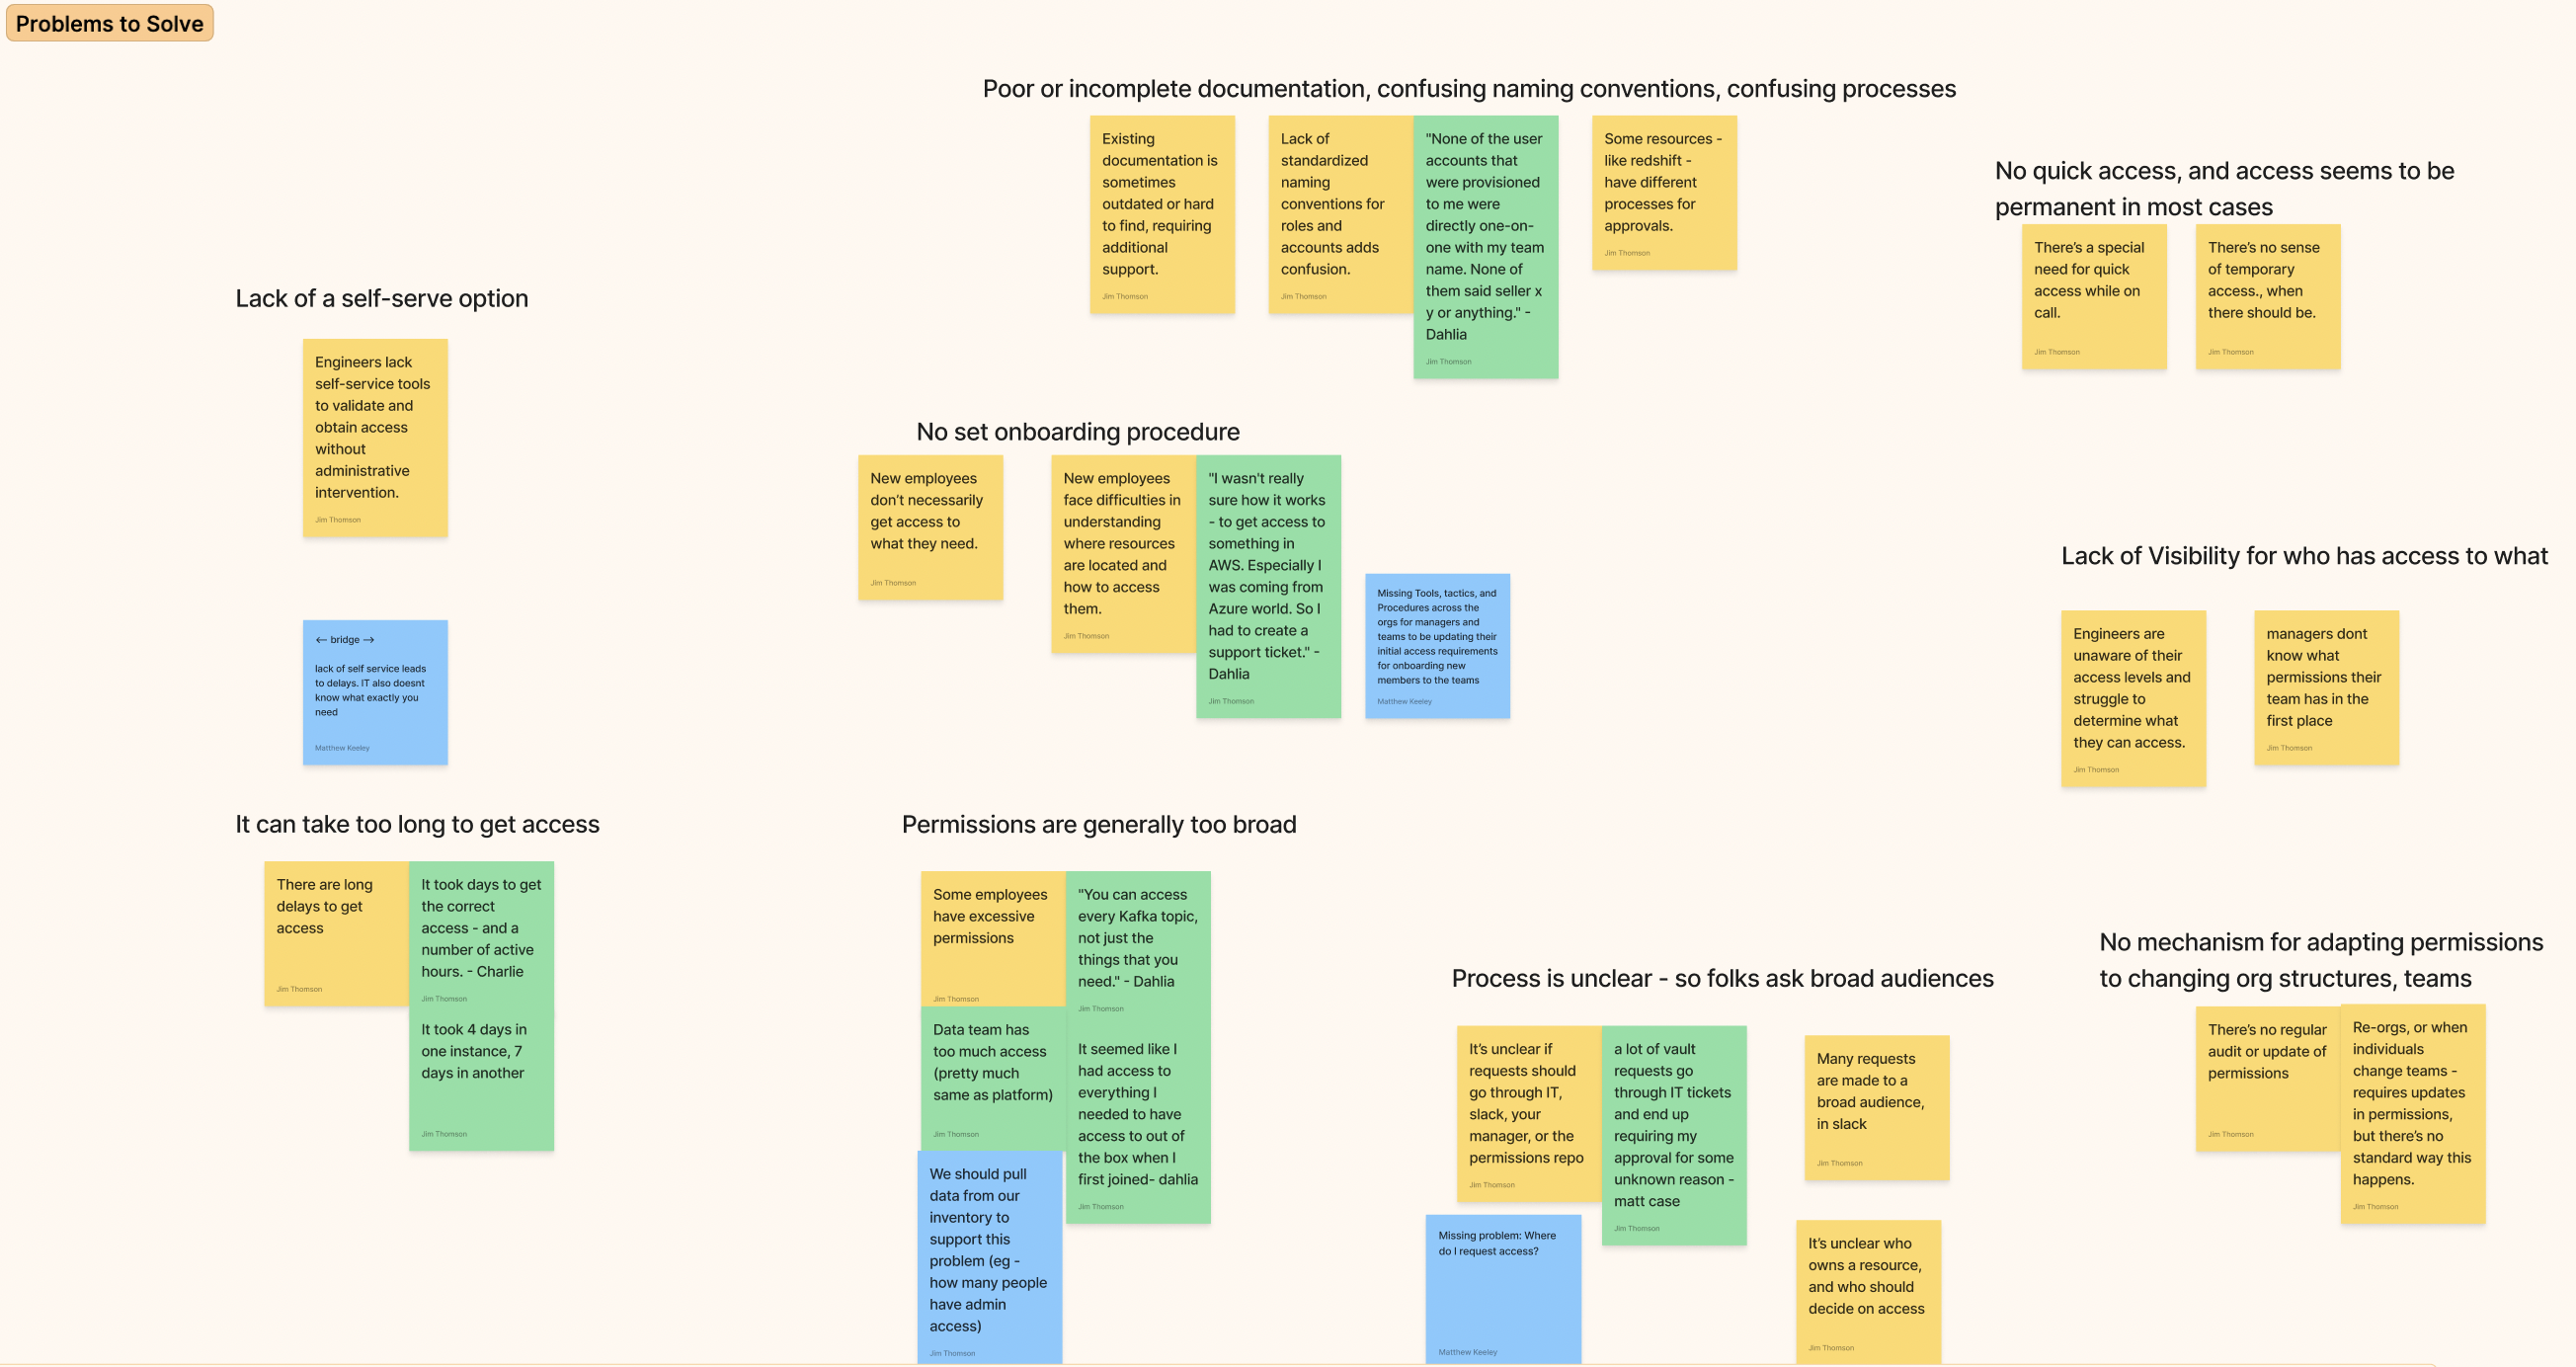
In Part 1 we shared the problem: IAM was slowing everyone down. Access requests were confusing, unpredictable, and sometimes invisible. People defaulted to workarounds. Risk grew as admin access spread. What we needed was not just a safer IAM system, but a better developer experience.
In this post, we will take you under the hood. This is the story of how we built Checkpoint, our internal IAM automation platform, and how it became the default way people at SeatGeek discover, request, approve, extend, and revoke access.
👉 Spoiler: a year in, requests complete in seconds, approvals happen in Slack, and permission cleanup is automatic.

Bundles: The Building Blocks of Access
At the core of Checkpoint is the bundle catalog.
A bundle is a pre-defined set of permissions tied to a service or workflow. Users select the bundle they need instead of piecing together permissions or requesting raw AWS roles.
How Bundles are Defined
Bundles are defined as config in Git. Service owners write them in Terraform alongside their infrastructure and commit them to Git. A typical bundle file contains:
- Name, description, roles, and policies, etc.
Ownership and lifecycle are managed through CODEOWNERS and group-based approvals, ensuring bundle changes undergo the same review process as other infrastructure, keeping definitions transparent, versioned, and auditable.
Here’s a shortened example of what a bundle looks like in code:
1 2 3 4 5 6 7 8 9 10 11 12 | |
How Bundles Work: Technical Implementation & User Experience
Bundles created with terraform are transformed into IAM policies. When a user requests a bundle, Checkpoint appends the bundle-{name} IAM policy to the user’s specific checkpoint-{username} permission set. Checkpoint dynamically unions IAM policies with AWS managed policies and applies them to the user’s permission set in real time.
Because bundle access is temporary by default, Checkpoint automatically ensures that the bundles fall out of the user’s permission set once the request expires. This means bundles act like reusable, scoped building blocks that can be layered together without leaving behind excess privileges.
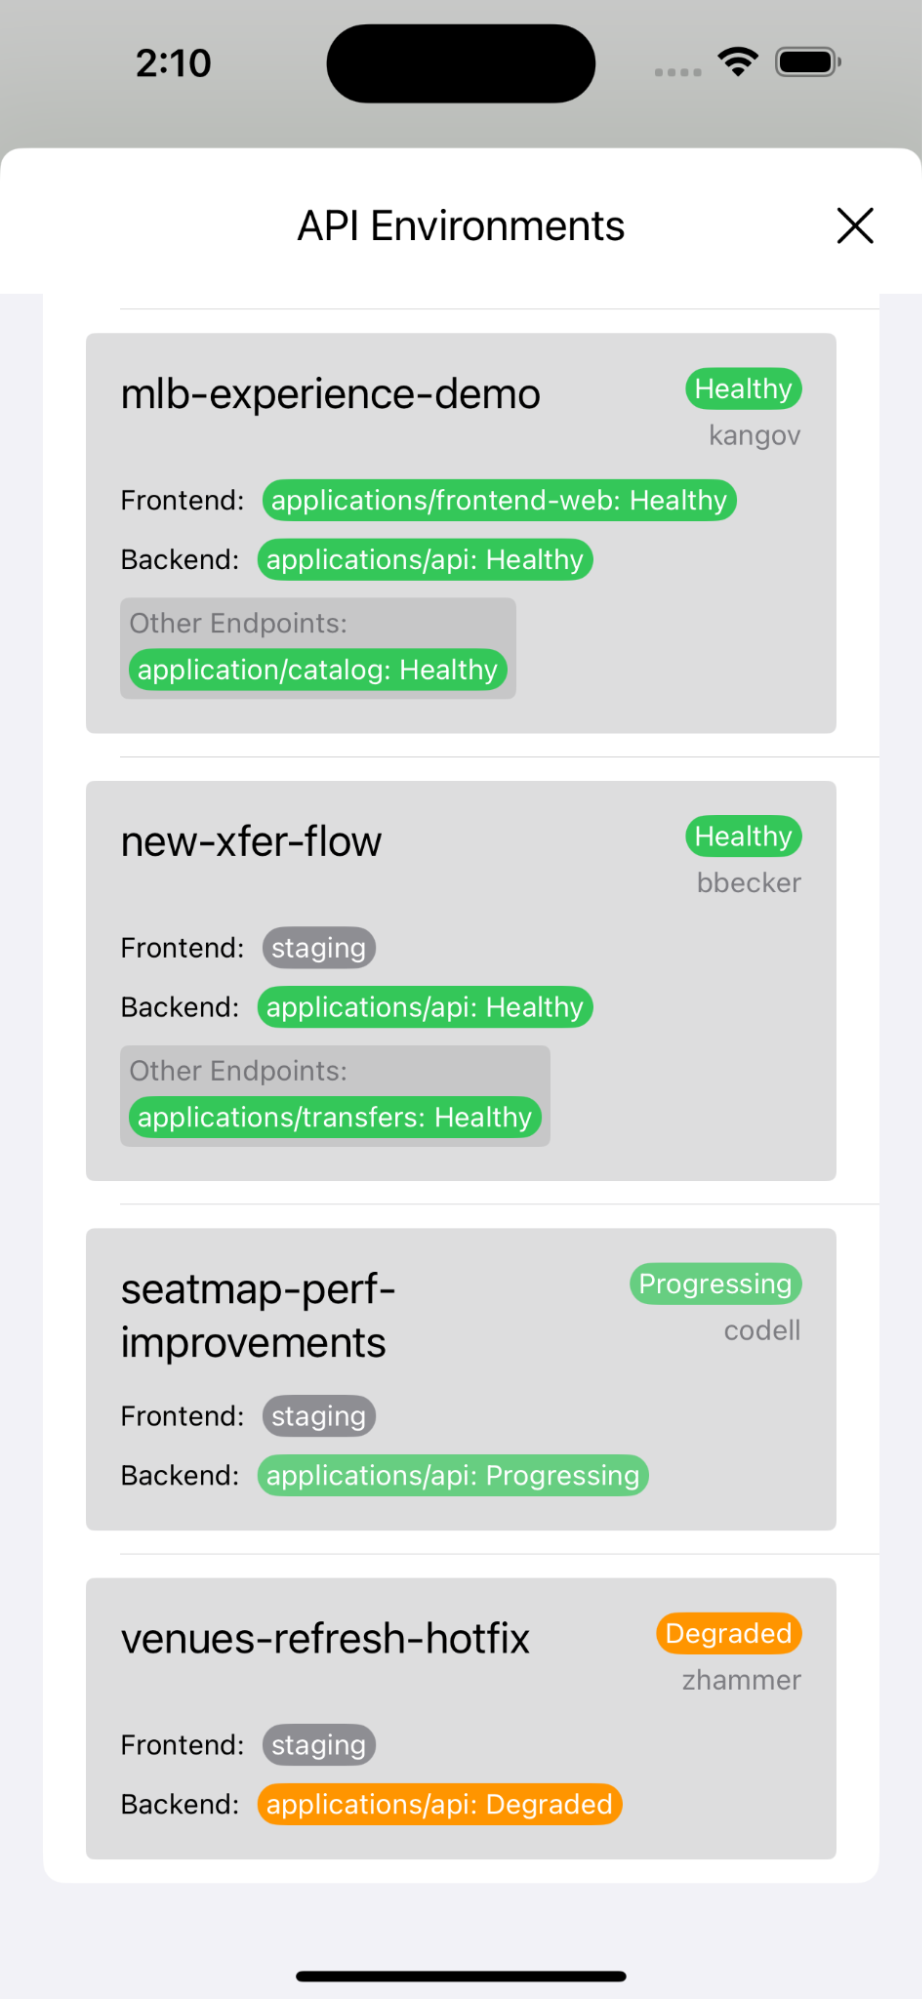
From the user’s perspective, bundles live in the Checkpoint catalog. The catalog can be browsed in the web UI or searched directly in Slack. Each bundle is displayed with its description, owner, and allowed request durations.
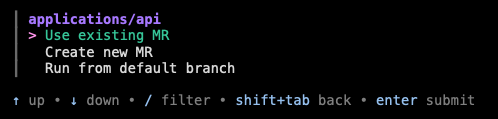
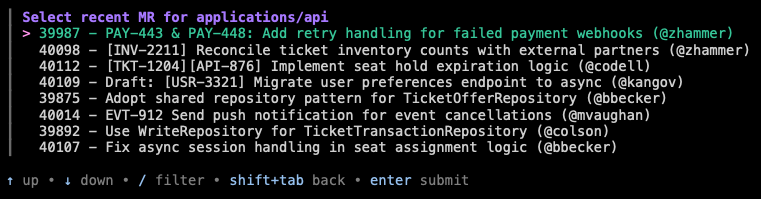
Requesting access is self-service. A user picks a bundle from the catalog, chooses a time window, optionally links a Jira ticket, and clicks submit. From there:
- Low-risk bundles are auto-approved instantly
- Higher-risk bundles follow the approval flow defined by the owner
- All activity is logged and auditable
This catalog model means engineers, analysts, and even non-technical staff can request the access they need without waiting on tickets, while service owners remain firmly in control of how their systems are accessed.
One Request Flow, Multiple Surfaces
The bundle catalog only works if people can actually reach it with ease. From the outset, Checkpoint was designed as an API-first system, allowing us to build diverse interfaces for different user types without duplicating logic. These surfaces all share the same backend request and approval logic.
- Website: A clean web UI with an Okta tile for non-technical users like marketing and finance teams.
- Slackbot: Slash commands in Slack for operational teams, making access requests feel like chatting with a teammate.
- API: Direct API access for programmatic integrations and automation.
Risk Scoring and Approvals
Speed without safety is noise. Safety without speed is friction. Checkpoint’s approvals engine ensures the secure path is the easiest path, keeping owners in control and auditors satisfied.
How Scoring Works
Every request is evaluated in real time based on:
- Bundle Metadata: Each bundle has a risk level assigned by its owner (
Low,Medium,High, orCritical). These are audited on every MR and quarterly to ensure accuracy. - Request Context: The length of time being requested.
- Bundle Ownership: Whether the requester is on the team that owns the bundle. Owners can be direct emails, Slack usergroups, or Okta groups, which keeps approval authority close to service owners without relying on brittle per-person lists.
This simplified model makes the system easy to understand, predictable for engineers, and lightweight to maintain.
Thresholds and Decisions
The risk level of the bundle sets the row, and the requested time window sets the column in our internal matrix.

- Auto (all): Instant access, no human in the loop.
- Auto (owner): Instant access, but the service owner is notified.
- Service Owner: The request goes to the owning team for approval.
- Platform Team: The central platform team (and sometimes Security) must approve.
This matrix keeps approvals simple and transparent. Engineers know what to expect before they click Request. Owners only see higher-risk or longer-lived requests. Platform and Security only get involved in rare, critical cases.
The Approval Card

When Checkpoint requires a human decision, it posts an interactive card in Slack. Each card contains:
- Who: The requestor
- Bundle Owners: Who or what team owns the bundle
- Which Bundle: What bundle is being requested (with links to see contents)
- Duration: The requested time window
- Reason: Free text reason and optional
Jiraticket - Actions: Approve, Deny, (In thread shorten duration and ask for additional details)
Approvers can make a decision in seconds without leaving Slack.
Approval Flow

To make this concrete, imagine an engineer requesting the seatgeek-api bundle, which is marked High risk because it touches production systems.
- If they request it for 2 weeks, Checkpoint routes it directly to the service owner. The request appears in Slack, the owner reviews the details, and within minutes the engineer is granted access.
- If they request it for 30 days, the flow changes. Because of the longer duration, the system automatically escalates it to the Platform team for approval, adding an additional layer of oversight.
This shift in approvals is intentional. It nudges engineers toward shorter requests that are auto-approved or quickly reviewed, while making long-lived access slower and harder to justify. Over time, this reshapes culture: instead of asking for broad, permanent access “just in case,” engineers learn they can get the access they need instantly “just in time.”
Identity and Permission Model
Checkpoint is not just about how requests are approved. It is also about how identities and permissions are modeled under the hood. If that model is too rigid or tied to the wrong anchors, it creates years of friction. If it’s too loose, it creates risk. The right balance is what allows bundles to feel simple on the outside while staying reliable on the inside.
Okta Groups as the Foundation
SeatGeek uses Okta as the source of truth for identity. Every employee is represented by a unique Okta group named checkpoint-{username}. These groups are the building blocks of our permission model.
Instead of assigning permissions to large teams or static org groups, we attach them to individual groups. This gives each person an isolated container that can grow or shrink based on the bundles they have checked out at any given time.
From 15 AWS Roles to One

Before Checkpoint, engineers logged into the AWS console and were greeted with a wall of roles. Some had ten or fifteen, all slightly different, with names that only made sense if you knew the history of a team or project. Choosing the wrong one meant hours of debugging access denied errors.
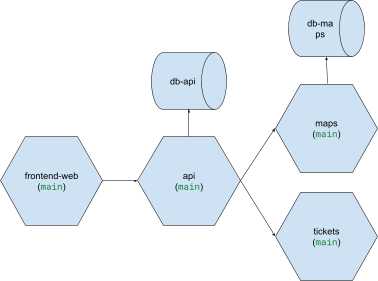
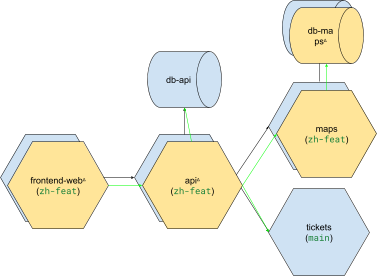
Now, with Checkpoint, there is only one role per person. That role is dynamically constructed from the bundles they currently hold. If you have requested the seatgeek-api bundle and a staging-data-tools bundle, your role contains the union of those permissions. When those expire, they fall out automatically.
The experience in AWS is radically simpler. You sign in, select your single SeatGeek role, and you are in.
Permission Sets: Individual Containers for Access
Behind the scenes, every user’s Okta group is mapped into AWS IAM Identity Center as a permission set. Each permission set is scoped to one employee and is unique. Permission sets allow us to attach IAM policies, AWS managed policies, and custom managed policies on a per-user basis. Two engineers sitting next to each other may have different bundles checked out at the same time, and that is reflected instantly in their permission sets.
Individual-Based Access: Why “Teams Are Dead”
A bundle request is always tied to a person, not a group. That individual might need production debug access today, staging read access tomorrow, and no special access at all next week. Teams are fluid, projects change, and individuals flow between them.
Team-based permissions are brittle because they tie identity to something temporary. Anyone who has gone through a reorg knows the pain: team names change, groups have to be recreated, permissions break, and by the time it is all fixed, it is time for the next reorg. This was SeatGeek every quarter.
One conventional approach to IAM at scale, outlined in guidance like Google’s Director’s Guide: IAM Security at Scale, uses a layered model: birthright access for all employees, job-based roles tied to HR records, and individual overrides for exceptions. That works at Google’s scale, where teams are large and stable enough to anchor permissions to org structure. At SeatGeek, every reorg would have forced us to rewrite half our permissions.

Instead, Checkpoint keeps a small amount of birthright access (basic engineering tools for engineers, basic office tools for everyone else) and makes everything else individual and request-based. Services are durable, but teams are not. By flipping the model to service-based bundles attached to individuals, we avoid the endless cycle of renaming, remapping, and breaking permissions. You need something, you request the bundle. That’s it.
This model enforces least privilege naturally, since only the bundles you explicitly ask for are attached to you. And because access is tied to individuals and services rather than teams and org charts, it survives reorgs without breaking.
Automation and Lifecycle
The identity and permission model described above is the foundation. This section walks through what actually happens when someone joins SeatGeek, requests a bundle, and eventually sees that access expire.
Onboarding a New User
When a new employee is given AWS access in Okta, an automation runs immediately:
Oktacreates a new group namedcheckpoint-{username}.- The employee is added as the only member of that group.
AWS Identity Centermaps that group to a unique permission set for the user.
This permission set is dedicated to that one individual, starting with only birthright access but designed to grow and shrink as bundles are attached and expire.

Requesting a Bundle
To make the request flow concrete, suppose the user mkeeley needs the eDWH bundle, which grants access to the Enterprise Data Warehouse:
- The user navigates to the Checkpoint website.

- They click
Request Access. - A form opens where they provide a reason, optionally link a
Jiraticket, and select a duration.
Requests can also be made through the Slack bot, but the core process is the same: the request ties a bundle to the user’s permission set. From there, the request enters the approval flow described above.

Once approved, Checkpoint updates the user’s permission set in real time. For checkpoint-mkeeley, the eDWH bundle policies are merged into the existing set, creating a unified permission set that always reflects the bundles the user currently holds.
The update is instant. The user does not need to log out or switch roles. They can retry their request or refresh the page and continue working.
Expiration, Extension, and Revocation
Access in Checkpoint does not end at approval. Every grant has a full lifecycle.
When a bundle is approaching expiration, Checkpoint sends a Slack notification to the user. From there, the user can submit an extension request, which follows the same risk and approval model as the original request. There is no need to start over from scratch. If the extension is approved, the grant continues seamlessly. If denied or ignored, the access expires on schedule.
When a bundle does expire, Checkpoint automatically removes the policies from the user’s permission set. The user returns to their baseline permissions. Access can also be actively revoked before expiration if circumstances change.
All bundle requests, approvals, extensions, and revocations are logged in an auditable internal database:
- Compliance: Every action has a traceable record.
- Transparency: Employees can see what bundles exist, who is using them, and request the same ones if needed.
Why This Works (and Why It’s Different)
Most IAM systems are built to enforce control, optimized for auditors and administrators rather than the people requesting access. This often results in long-lived permissions, frustrated engineers, shadow processes, and an ever-growing pile of exceptions.
Checkpoint takes a different approach. In Part 1, we described the principles that guided its design. In practice, Checkpoint turns those principles into a product experience that engineers actually want to use.
- Fast and Predictable Access: The decision matrix is transparent. Low-risk requests are auto-approved in seconds, while higher-risk or long-lived requests route to owners. Engineers know what to expect before they click request.
- Ownership with Context: Service owners approve access to their own systems. They have the context to make the right call, while Platform and Security step in only for privileged bundles.
- Temporary by Default: Every request expires on its own. Cleanup is automatic, ensuring no hidden admin accounts sit around unused. Least privilege is enforced by the system itself.
- Cultural Alignment: The fastest way to get access is to ask for less of it. Engineers learn that shorter windows are instant, while longer requests take longer and require more justification. Over time, this shifts behavior toward least privilege without enforcement by policy alone.
- A Product, Not Plumbing: Checkpoint feels like a product. It has a catalog, clear flows, and interfaces that people enjoy using. That visibility builds trust, which is why it quickly became the default path for access across SeatGeek.
Checkpoint works because it is designed for the people who need access, not only for the teams that audit it later. That is what makes it different from the IAM systems that came before it.
The Future of Checkpoint
Checkpoint’s model is not only limited to AWS. Once access is represented as a requestable bundle with owners, risk, duration, approval, expiration, and audit, the same just-in-time lifecycle can reduce the risk of standing privileged access in other sensitive internal services. We have expanded existing Checkpoint bundles to provision JIT access to internal API keys, avoiding overexposure without introducing additional friction.
After a year on the critical access path, Checkpoint has transformed how our teams work. Engineers now get access in seconds instead of days. Service owners make better decisions with less overhead. Platform and Security focus on the highest-risk cases rather than rubber-stamping tickets. Onboarding is faster, compliance is cleaner, and the company runs with far fewer exceptions. The long-term shape is a single just-in-time access plane across SeatGeek: one request flow, many sensitive systems, temporary grants by default.