Introduction: Getting the Most Out of CI
Moving CI runners to Kubernetes was a game changer for our engineering teams. By adopting the GitLab Kubernetes Executor and Buildkit on Kubernetes, we resolved many painful issues we had with our old system like resource waste, state pollution, and job queue bottlenecks. But we weren’t content to stop there. Running on Kubernetes opened the door to deeper optimizations.
In this final installment of our CI series, we explore five critical areas of improvement: caching, autoscaling, bin packing, NVMe disk usage, and capacity reservation. These changes not only enhanced the developer experience but also kept operational costs in check.
Let’s dive into the details!
Caching: Reducing Time to Pipeline Success
Caching (when it works well) is a significant performance and productivity booster. In a Kubernetes setup, where CI jobs run in ephemeral pods, effective caching is essential to avoid repetitive, time-consuming tasks like downloading dependencies or rebuilding assets. This keeps pipelines fast and feedback loops tight.
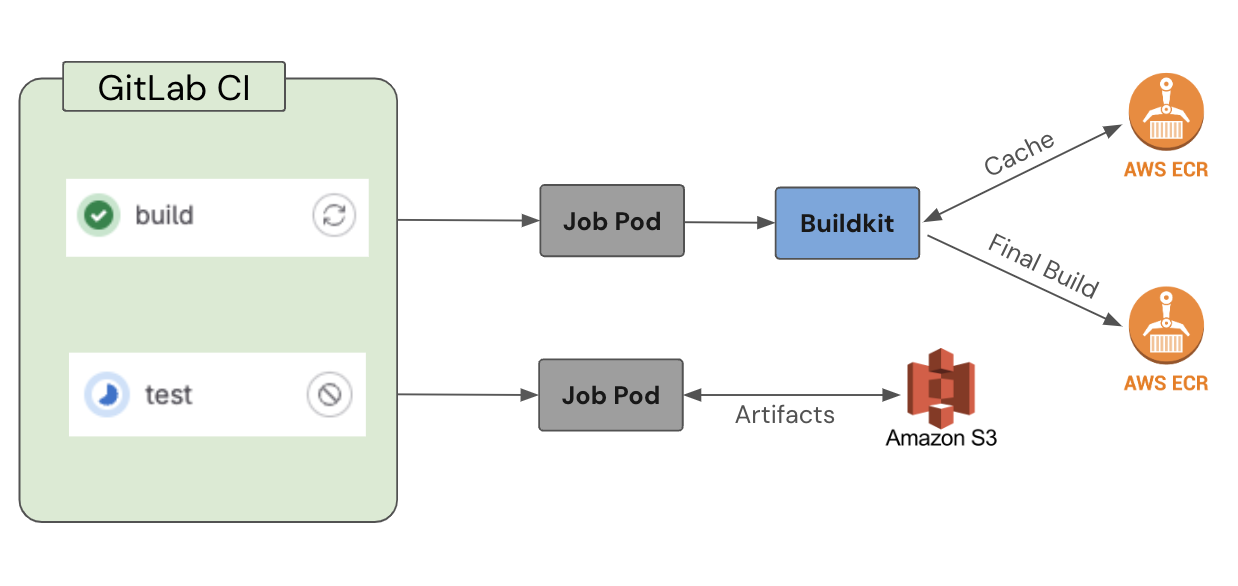
We use S3 and ECR to provide distributed caching for our runners. We utilize S3 to store artifacts across all jobs with lifecycle policy that enforces a 30 day expiration. We use ECR to store container image build caches with a lifecycle policy that auto-prunes old caches to keep us within the images-per-repo limits.
These are both used by default to significantly reduce job times while maintaining high overall reliability.
Why are Builds so Slow?
One interesting issue we ran into with build caching is that when preforming multi-architecture builds our caches would alternate between architectures. For example:
-
Pipeline 1 = amd64 (cached) arm64 (no cache) -
Pipeline 2 = amd64 (no cache) arm64 (cached) -
Pipeline 3 = amd64 (cached) arm64 (no cache) - … and so on
Sometimes builds would benefit from local layer caching if they land on the right pod, in which case both architectures would build quickly, making this a tricky problem to track down.
This behavior is likely due to how we build each architecture natively on separate nodes for performance reasons (avoiding emulation entirely). There’s an open issue for buildx that explains how, for multi-platform builds, buildx only uploads the cache for one platform. The --cache-to target isn’t architecture-specific, so each run overwrites the previous architecture’s cache.
Our current workaround is to perform two separate docker buildx build calls, so the cache gets pushed from each, then use docker manifest create && docker manifest push to stitch them together.
With this in place we’re seeing up to 10x faster builds now!
Autoscaling: Working Smarter, Not Harder
One of Kubernetes’ standout features is its ability to scale dynamically. However, getting autoscaling right is a nuanced challenge. Scale too slowly, and jobs queue up. Scale too aggressively, and you burn through resources unnecessarily.
Scaling CI Runners
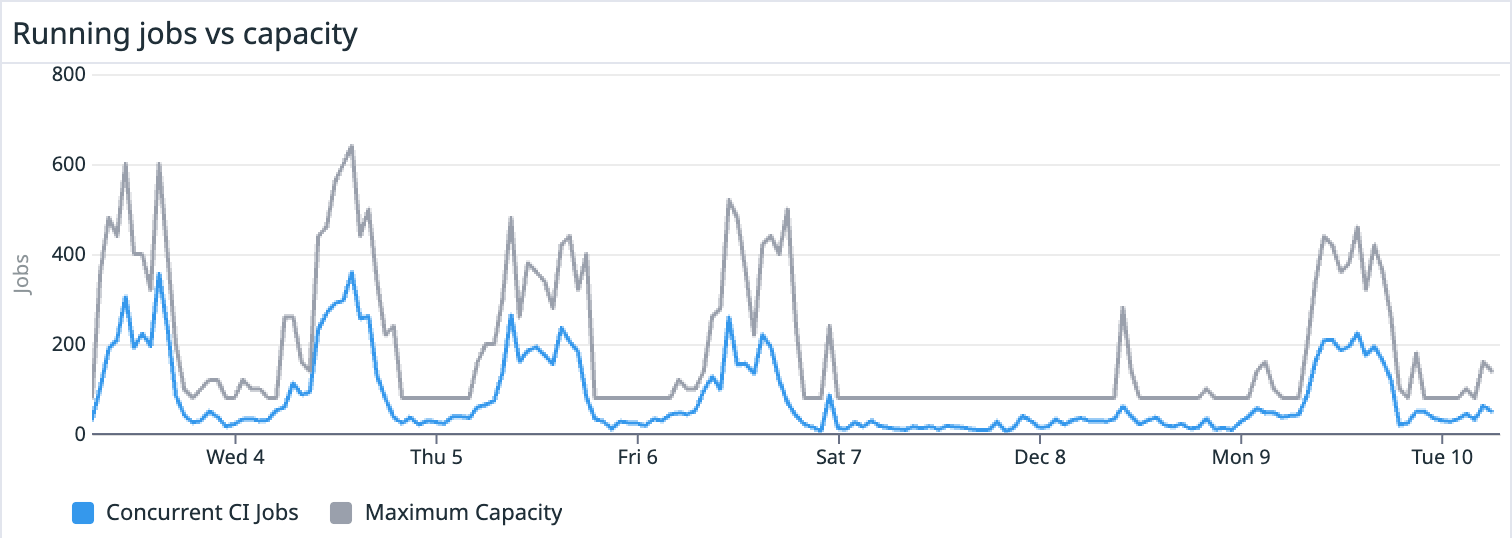
We used the Kubernetes Horizontal Pod Autoscaler (HPA) to scale our runners based on saturation: the ratio of pending and running jobs to the total number of available job slots. As the saturation ratio changes, we scale the number of runners up or down to meet demand:
But this wasn’t as simple as turning it on and walking away - we had to fine-tune the scaling behavior to avoid common pitfalls:
- Scale-Up Latency: If many jobs come in around the same time, it can take a bit for the runners to scale up enough to meet that demand. We’re currently targeting a saturation ratio of 70%. When exceeded, the system is allowed to double its capacity every 30 seconds if needed, with a stabilization window of 15 seconds.
- Over-Aggressive Scale-Downs: To avoid thrashing from scaling down too much (and/or too fast), we scale down cautiously - removing up to 30% of available slots every 60 seconds, and waiting for a 5-minute stabilization window before taking action.
The result? Our CI runners now scale seamlessly to handle peak workloads while staying cost-efficient during quieter times.
Scaling Buildkit
In our previous post, we shared how we run Buildkit deployments on Kubernetes to build container images. We also leverage an HPA to scale Buildkit deployments to try and match real-time demand.
Unfortunately, Buildkit doesn’t expose any metrics for the number of active builds, and our cluster doesn’t yet support auto-scaling on custom metrics, so we had to get creative. We ended up autoscaling based on CPU usage as a rough proxy for demand. This hasn’t been perfect, and we’ve had to tune the scaling to over-provision more than we’d like to ensure we can handle spikes in demand.
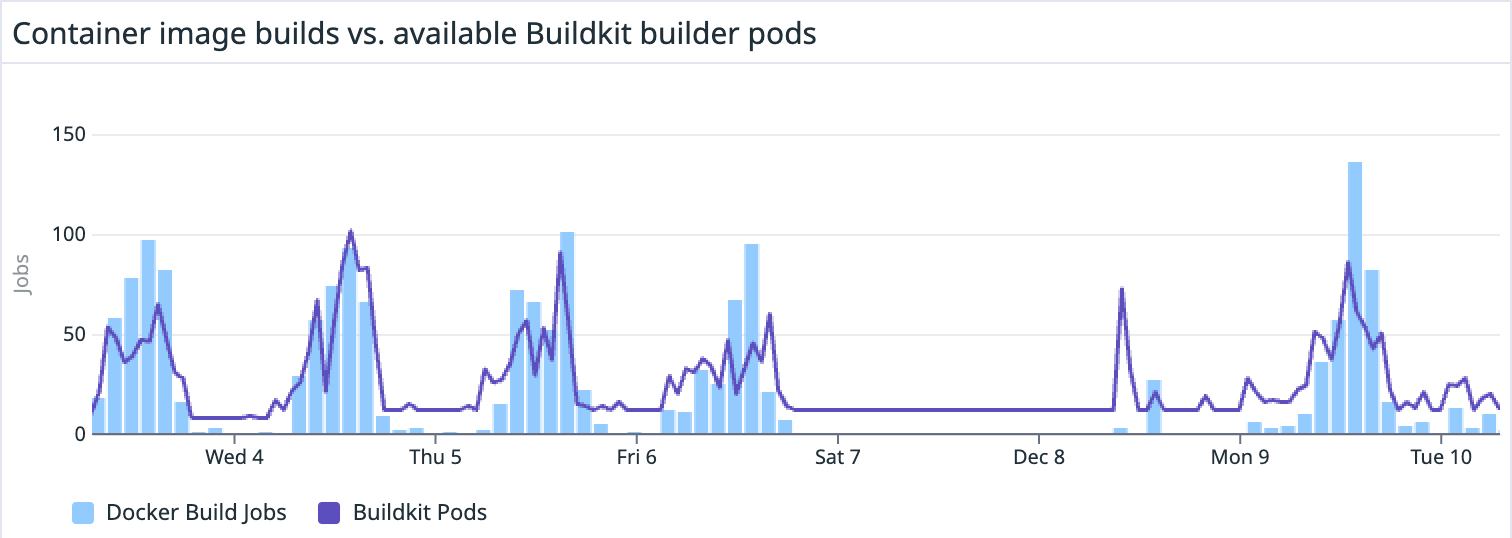
We’d eventually like to shift our strategy to use ephemeral Buildkit pods that are created on-demand for each build and then discarded when the build is complete. This would allow us to scale more accurately and avoid over-provisioning, but at the cost of some additional latency. This would also help solve some issues we’ve been having with flaky builds and dropped connections that may be due to resource contention or state pollution.
Bin Packing: Maximizing Node Utilization
Kubernetes’ scheduling capabilities gave us the tools we needed to improve how jobs were placed on nodes, making our cluster more efficient. This is where bin packing came into play.
We defined dedicated node pools for CI workloads with sufficient resources to handle multiple concurrent jobs with ease. With this we gave CI jobs dedicated access to fast hardware with NVMe disks, and opted-out of using spot instances to guarantee high reliability for the pipelines:
1 2 3 4 5 6 7 8 9 10 11 12 13 14 15 16 17 18 19 20 21 22 23 24 25 26 27 28 | |
To ensure that Karpenter wouldn’t disrupt CI jobs before they finished, we configured pod-level disruption controls to ensure the jobs (and their underlying nodes) wouldn’t get rug-pulled.
1 2 3 4 5 | |
We then set informed defaults for resource requests, along with reasonable limits, to efficiently pack CI jobs onto nodes without them becoming “noisy neighbors”. We also allowed developers to set their own elevated requests and limits for resource-intensive jobs, ensuring fast execution. This fine-tuning reduced fragmentation and avoided over-provisioning resources.
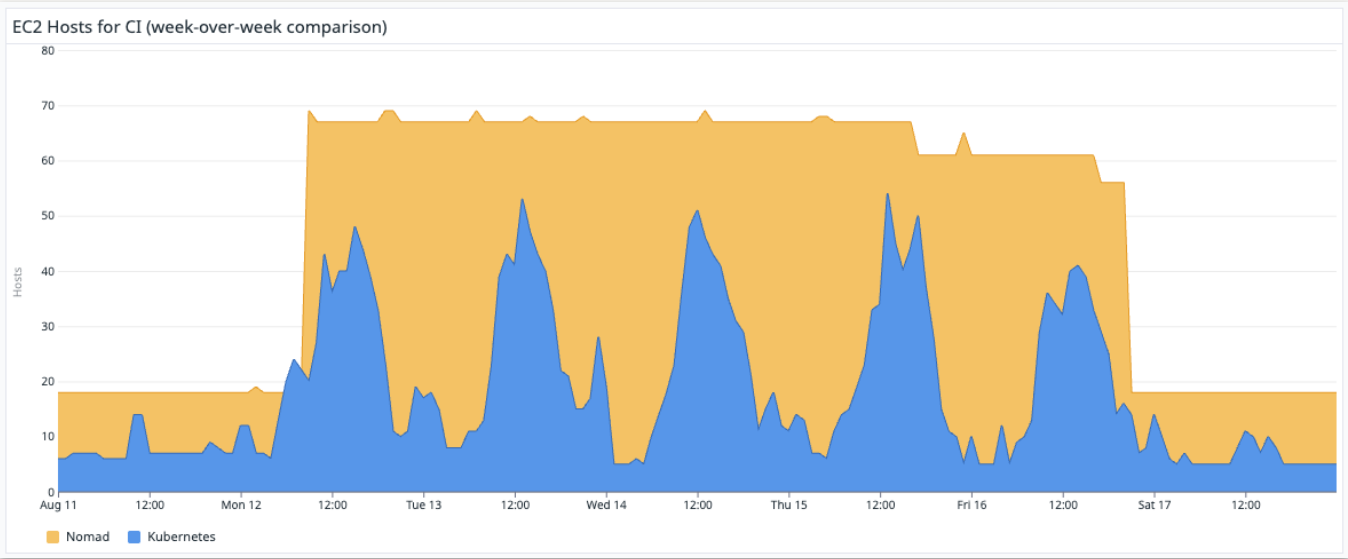
The payoff was significant. We saw higher utilization across our CI node pools, using fewer hosts, and without the instability that can come from overloading nodes.
NVMe Disk Usage: Turbocharging I/O
Disk I/O often becomes a bottleneck for CI workloads. Leveraging NVMe storage improved our build times by reducing disk read/write latency.
Unfortunately, Bottlerocket doesn’t support using the local NVMe drive for ephemeral storage out-of-the-box, so we adapted this solution to use a bootstrap container to configure that ephemeral storage on node startup.
Capacity Reservation: Ensuring Spare Nodes for CI Workloads
Autoscaling is powerful, but waiting for nodes to spin up during usage spikes can cause frustrating delays. That’s why we implemented capacity reservation to keep spare nodes ready for CI jobs, even during off-peak hours.
We did this by over-provisioning the cluster with a few idle pods with high resource requests in the CI namespace. If Kubernetes needs to schedule a CI job but lacks available nodes, the higher-priority CI job will cause the lower-priority “idle” pod to immediately get preempted (evicted) to make room for the job, allowing it to start immediately. Kubernetes will then spin up a new node for that idle pod, ensuring the cluster has spare capacity for any additional jobs.
These pods also have init containers that simply pre-pull frequently used container images. This ensures that new nodes can start running CI jobs immediately without waiting for those images to download.
The result? CI jobs start immediately, with no waiting around for new nodes to spin up. Developers are happy, and our cluster stays responsive, even during peak hours.
Conclusion: Fine-Tuning CI for Developer Happiness
By leveraging caching, autoscaling, bin packing, NVMe disks, and capacity reservation, we’ve significantly improved both developer experience and operational efficiency. The outcome of this, along with the overall migration of runners to Kubernetes, can be summarized with the following metrics:
-
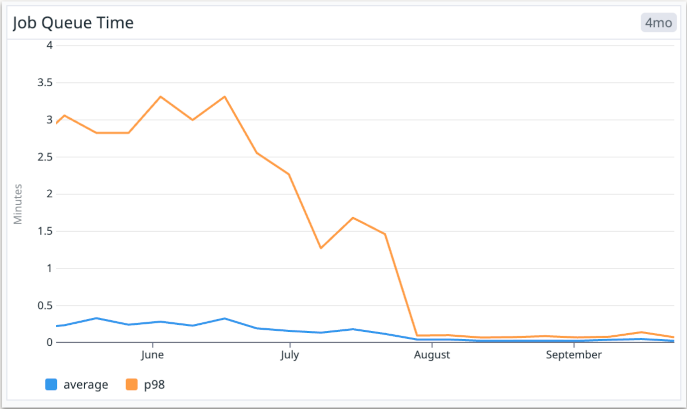
Job Queue Time: The average time for a pending job to be picked up by a runner has dropped from 16 seconds to just 2 seconds. Even more impressive, the p98 queue time has gone from over 3 minutes to under 4 seconds. Developers get faster feedback loops so they can focus on getting shit done.
-
Cost Per Job: By optimizing resource utilization and scaling intelligently, we’re now spending 40% less per job compared to our previous setup. That’s a huge win for keeping our CI pipelines cost-effective as we continue to scale.
The journey to perfecting CI is iterative, and every improvement brings us closer to a system that’s faster, more reliable, and more cost-efficient. These improvements showcase how a well-architected and finely tuned CI system can deliver substantial value; not just in raw performance metrics but also in terms of real measurable developer productivity.

