📢 Want to learn more about how SeatGeek built Ephie: a composable, quick, and easy-to-use solution for ephemeral environment testing? Check out our upcoming talk at KubeCon/ArgoCon in November: Beyond Review Apps: Orchestrating Full-Stack Ephemeral Environments with Argo CD.
There is a conflict at the heart of the shared staging environment. It starts with the individual, the team, which wishes to use the environment to test. The statement is thus:
“I would like to use this environment to test my code.”
This carries two suppositions:
- That I will introduce (possibly) faulty code into the environment so that I can catch its bugs, correct its failures, and preview my changes before they go live to users.
- That I require all other services, infrastructure, and applications in the environment to be stable, so that if something goes wrong, I can isolate the fault to my own code.
In a world with one team, with one user, this makes sense. I (me, Zach, the developer experience team) go and deploy my code to my application in staging, which is stable, and then do all sorts of tests, experiments and use cases on it, seeing what breaks, seeing what works, demo’ing to stakeholders, etc. The moment we introduce a second user, a second team, to this shared environment, a conflict arises. I (Zach) would like to deploy a possibly faulty version of my application to our “shared” staging environment. But also you would like to do the same as well, to another application which talks to mine. What do we do?
In this post we will discuss how we solved the test environment problem at SeatGeek: an approach to ephemeral environments that blends a “shared, stable staging” foundational environment with configurable, intuitive, and fast-to-deploy constellations of connected applications which rest on top of, but exist in semi-isolation from, that stable foundation.
Beginnings
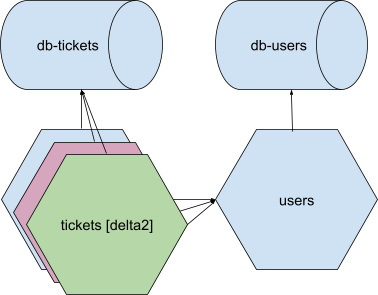
Already most organizations have solved the conflict of members of a team wanting to deploy the same application. Here we introduce “single application review apps” or “preview apps”, which allow for multiple deployments of an application. If you and I both want to deploy to our “tickets” application, we each deploy “tickets [delta]” applications, which connect into our shared environment but each have their own unique ingresses (which other applications in the environment do not call out to), so I can test changes to “tickets [delta1]” while you test changes to “tickets [delta2]”.
But rarely do the changes we’re testing, especially ones which require us to invoke the shared, staging environment (rather than a local test), involve only one application! More likely, the changes touch many applications, or test parts of the application which cannot be isolated only by means of ingress (e.g. an http service, which only responds to ingress HTTP requests from the user, is easy to isolate; a rabbit consumer, which reads from a shared queue, and publishes back to a shared resource, is more difficult.) The single application review apps only brought us so far.
A solution hovers in the air: make a complete clone.
If we all want to test code, and we all want our own complete isolation, let us raise up an entirely new, and entirely unique, isolated staging environment from the ground. It shall have “everything we need”; every application which touches, by some means, our code, as well as all of the infrastructure, all of the network rules, all of the resources, that are required for all of these applications to run.
In a small organization this may work; but, in a sufficiently complex engineering department, with a sufficiently scaled technology stack and landscape, this becomes more and more unfeasible. Cost soars, start-up times become untenable, and core resources in the stack are found with less declarative configurations (as in, that old database which no one has touched for years cannot be told, simply, to “stand up”.) The impossibility of this task, as solved by the solution that immediately presents itself, is daunting.
But then we can go back, we can ask: what is it people need? They don’t need a fully replicable environment, in which, like the traversal of a graph, all things touched come to life, unique. I, testing my tickets application, really do not care so much at all (insofar as I even know it exists) as to the size, functionality, replicability of some database tucked far away into my accounting stack. What is important is that my application can run, sending calls out into the void, getting some behavior back, in which I can confirm not only the behavior of my application in itself but also the way it impacts others.
“So then let’s mock!”
Or, let’s create some temporary, adjustable adapters into which tickets service can call out to users service and get some pre-programmed response back that lets the application run, as if end-to-end, but only shows a replica of the behavior we would expect had we been actually sending requests out to other running services. It’s a reasonable approach, but limits us in that:
- We now have to create (constantly iterated upon) mocks of existing services, which may be difficult especially for dynamic behaviors and use cases which we seek to simulate in our staging environment.
- We now introduce the possibility that behavior we see in our end-to-end tests does not actually reflect the status of running applications (those which are deployed to production) but of misconfigurations in our mocks.
Perhaps we’ll come to a point with certain interfaces in our system (say, with third party dependencies, or particular connections between applications which are preferable to mock rather than run end-to-end) in which this approach is useful, but as a generic solution it introduces more work and creates less confidence in our staging environment than it is worth.
This is, clearly, a complex problem to solve!
Identification & Prioritization
The need for a revamp of our approach to shared environment testing came from our internal user research program. Developer Experience (DevX) at SeatGeek runs quarterly interviews, in which all members of our team take turns facilitating 1-on-1 interviews with members of all roles in the engineering department to ask about the challenges and successes of how developers develop; we ask broad questions about frustrations their teams face when interacting with their platform, narrower questions about testing strategies within their teams, and fun, open-ended questions like what one would do to change SeatGeek engineering, overall, if they had a magic wand. (We also ask get-to-know-you questions like: “what was your favorite live event?”) Besides surfacing opportunities for DevX to deliver high impact solutions to improve developers’ work, these conversations also serve to build rapport between DevX and non-Platform engineers and to nurture a product-first mindset for DevX engineers, who see, constantly, the impact of their own solutions and also the real challenges developers face.
With the ability to quickly report on large swaths of open-format interview data (via tools like ChatGPT), we can more easily than ever build cases for prioritization, both within our team, and also in how we communicate out to the broader Platform and Engineering organizations at large, based on customer input. In our 2024H2 planning, we deduced, from 20 interviews spanning the previous year, that the largest challenge facing developers at the time was that: “Deployment frequency is slowed by the lack of cross-system testing mechanisms and low confidence in production changes overall.” We set out in that half with a mandate to fix the cross-system testing problem.
Solving a big problem
Over time, a big, shared resource with ambiguous ownership leads to different expectations. One team says: staging is this environment that is broken all of the time and if, on a good day, I can run a test there, that’s great. Another says: I need staging so that I can deploy some changes to my application, see it on a sandbox frontend environment (through which calls are traversing through several applications and resources to bring that path to life), and demo it to stakeholders, or even outside clients, so that I can progress through the most run-of-the-mill operations on my team. Some teams have a standard of always resetting their staging application to the most recent production-like version of the code when they are done testing. Others let a 2-year-old test branch sit on staging for long past the feature that the branch implemented has been released.
All of this creates, within an organization, a little political field into which disputes occur, tensions rise, and different team practices reveal themselves. We started our work to fix the cross-system testing problem by conducting more finely scoped interviews with teams and individuals, especially those who felt most blocked by the current state of our staging environment. We also sat in on different group discussions, like those in our engineering guilds and ops reviews, to better understand the challenges that teams faced in relation to staging testing and also the diverse expectations of what staging should do.
The pattern that arose from these discussions connected both the technical, testing challenges that teams face and the cross-team disputes on the nature of the staging environment. When a team faced a constraint to their ability to test out some functionality that required them to off-ramp from the “single application review app”, they would deploy their changes to the shared staging instance of the application, or application constellation, they intended to test. So instead of deploying a unique “tickets [delta1]” application into the environment that only I knew about, I would override the shared tickets application with my [delta1] changes, potentially introducing bugs or breaking changes to other teams. Or I would, working on a high impact, cross-system feature, hold control over several applications in a constellation, booting other engineers off of my constellation while I worked.
We found three major cases where this happens (not mutually exclusive):
-
Path to frontend: I want to deploy changes to a backend application and validate that they produce the expected behavior on a given frontend. (To connect my backend to my frontend, there is a path of interstitial applications that must be in the constellation; e.g. “frontend” connects to “checkout” which connects to “tickets” which connects to “transfers”, my backend application.)
-
Asynchronous callpaths: I want to deploy changes that involve non-HTTP callpaths, such as a ticket processing application in which messages are passed between RabbitMQ or Kafka workers, and validate the application behaves as expected.
-
Complex multi-application: I want to deploy changes to multiple systems that communicate over various channels (e.g. http requests, asynchronous events) using local and shared resources (e.g. a rabbit broker) and validate that the applications in conjunction produce the expected behavior.
By carving into these use cases, we could accelerate developer cycles (of teams that need to perform until-then unsupported or difficult to run testing scenarios) and increase staging stability (by requiring fewer engineers to introduce potentially faulty changes to shared staging.) We would do this by partnering with the teams impeded most directly by lack of ephemeral test environments, bringing substantial gains to key parts of our product while iterating on a solution that we would promote, over time, from POC (with a small group of dedicated, enthusiastic users) to production. In our early investigations, we learned that our inventory team’s productivity would grind to a halt whenever they needed to test RabbitMQ-dependent multi-application features, as there was then no support for isolated RabbitMQ exchanges. This (RabbitMQ isolation between two specific applications) was the case we started with, in a partnership with that team. As a result of the work we did that increment, test cycles were shortened by days; in exchange we received helpful feedback from engineers on UI experiments and assistance understanding the complexities of inter-application communication patterns in our product landscape. After a handful of these targeted partnerships, we were ready to release Ephie as GA.
Ephie
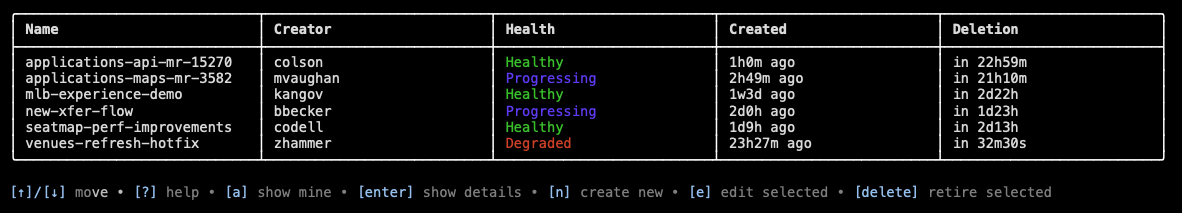
Ephie (short for ephemeral) is an interactive CLI tool nestled inside our globally distributed DevX toolkit binary, letsgo (see our upcoming KubeCon Platform Engineering Day talk “letsgo: The Ultimate Platform CLI” to learn more.) To create an ephie, I run letsgo ephie manage, which shows my (or all) existing ephie environments, and type [n] to create my env.
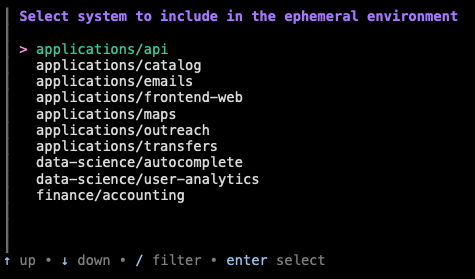
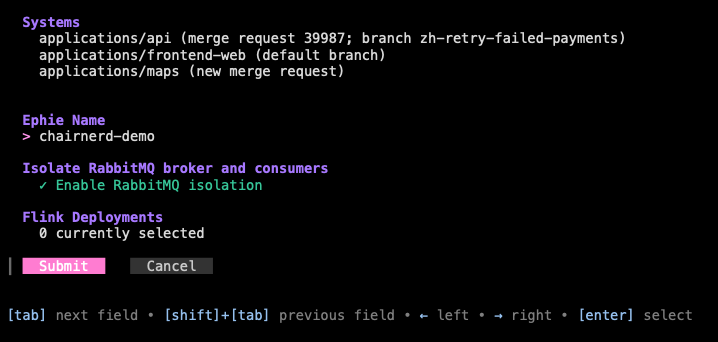
I am then led through an interactive menu which allows me to add any set of applications (specified by their repository slugs) to my ephemeral environment, choose a name, and, if I’d like, enable certain integrations (such as an isolated RabbitMQ broker or Flink job).
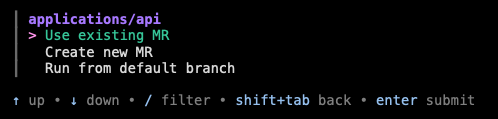
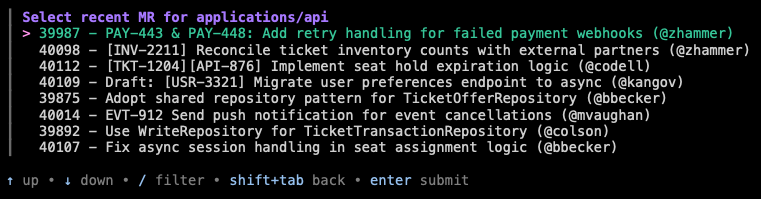
For each application I include, I am prompted if I would like to run that application in my ephemeral overlay using the default branch, or from an existing MR (I also have the option of creating a new MR right from the CLI.) If I select “existing MR”, I am prompted first with MRs which I have created, the usual case for developers creating test environments. (There is also a non-interactive version of this command that can be used in our CI pipelines to automatically create preview deployments or can be invoked by AI agents.)
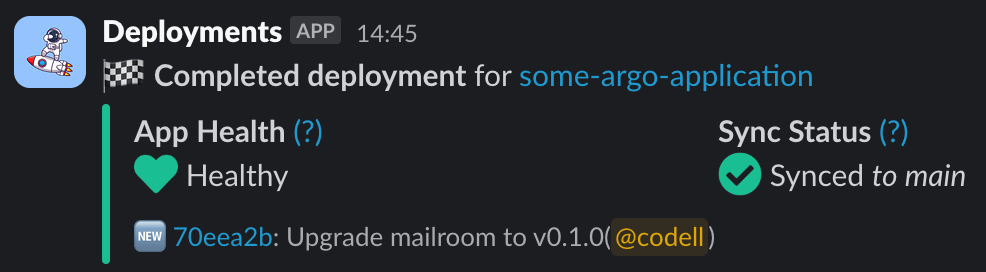
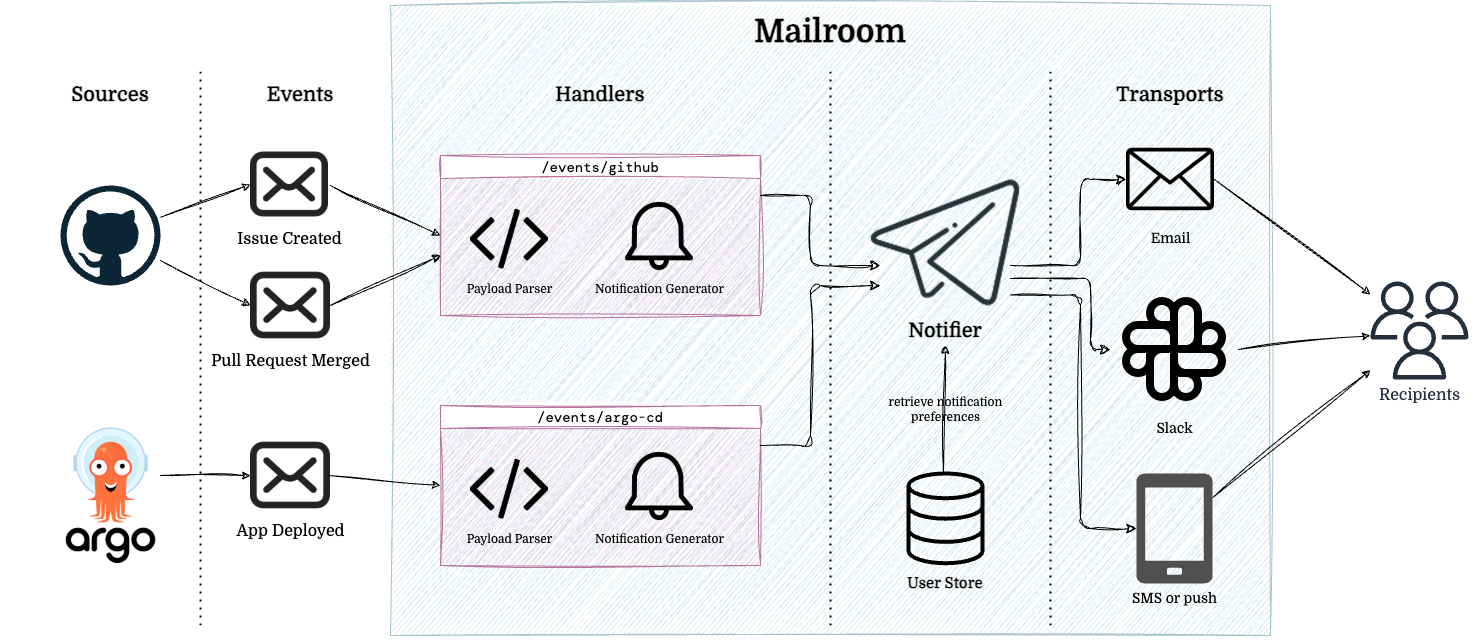
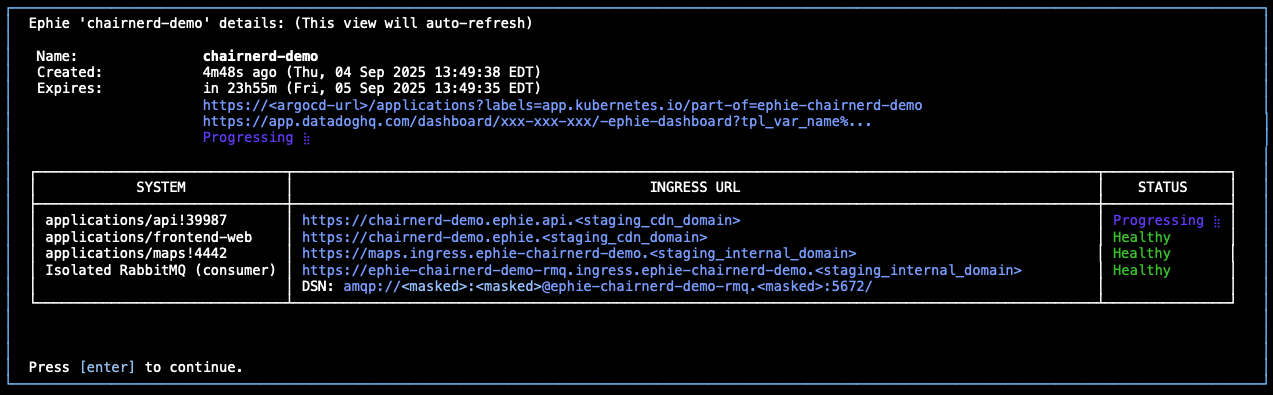
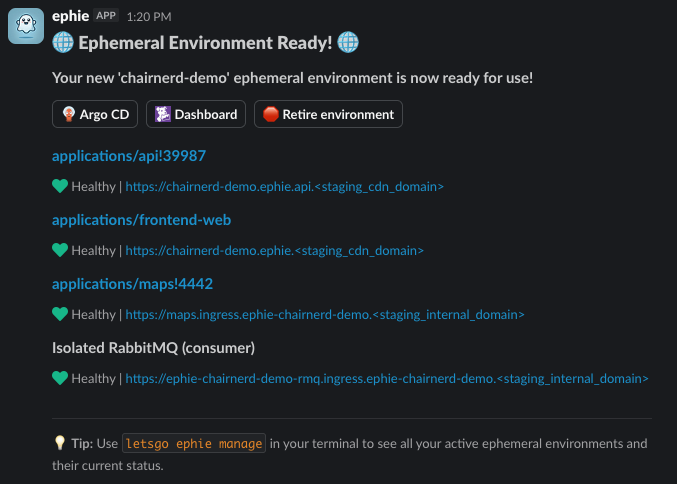
Once I submit my ephie, I am shown a detailed status screen (with links to all of my relevant resources) and am sent notifications via Slack as to the progress of my environment, notified ultimately when all aspects of the environment are deployed and ready to be tested. (These are powered by our Mailroom notification framework.)
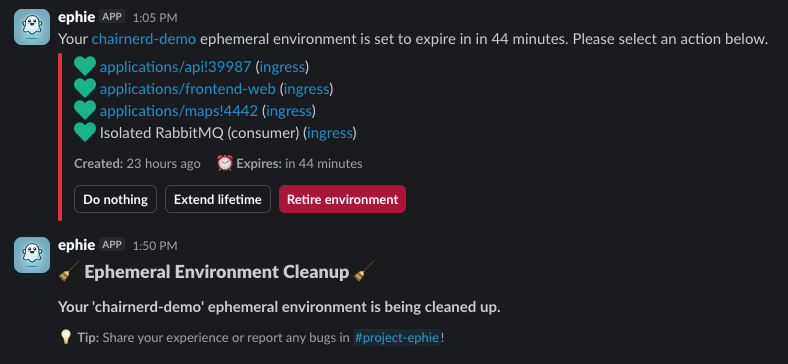
At any point, I can edit my ephie via the letsgo ephie manage UX, or can delete the ephie once I’m done testing. (The environment will automatically be deleted once all MRs associated with it are closed. It will also auto-delete after some time period of inactivity, prompting me beforehand if I’d like to extend its life.)
Outside of the resources of the environment themselves, I’m also given a pre-built, customized Datadog dashboard which allows me to introspect all the key aspects of my ephie: I can see traces which flow through my deployed applications, as well as telemetry on resources, like message count in my isolated RabbitMQ cluster, if I’ve opted for one.
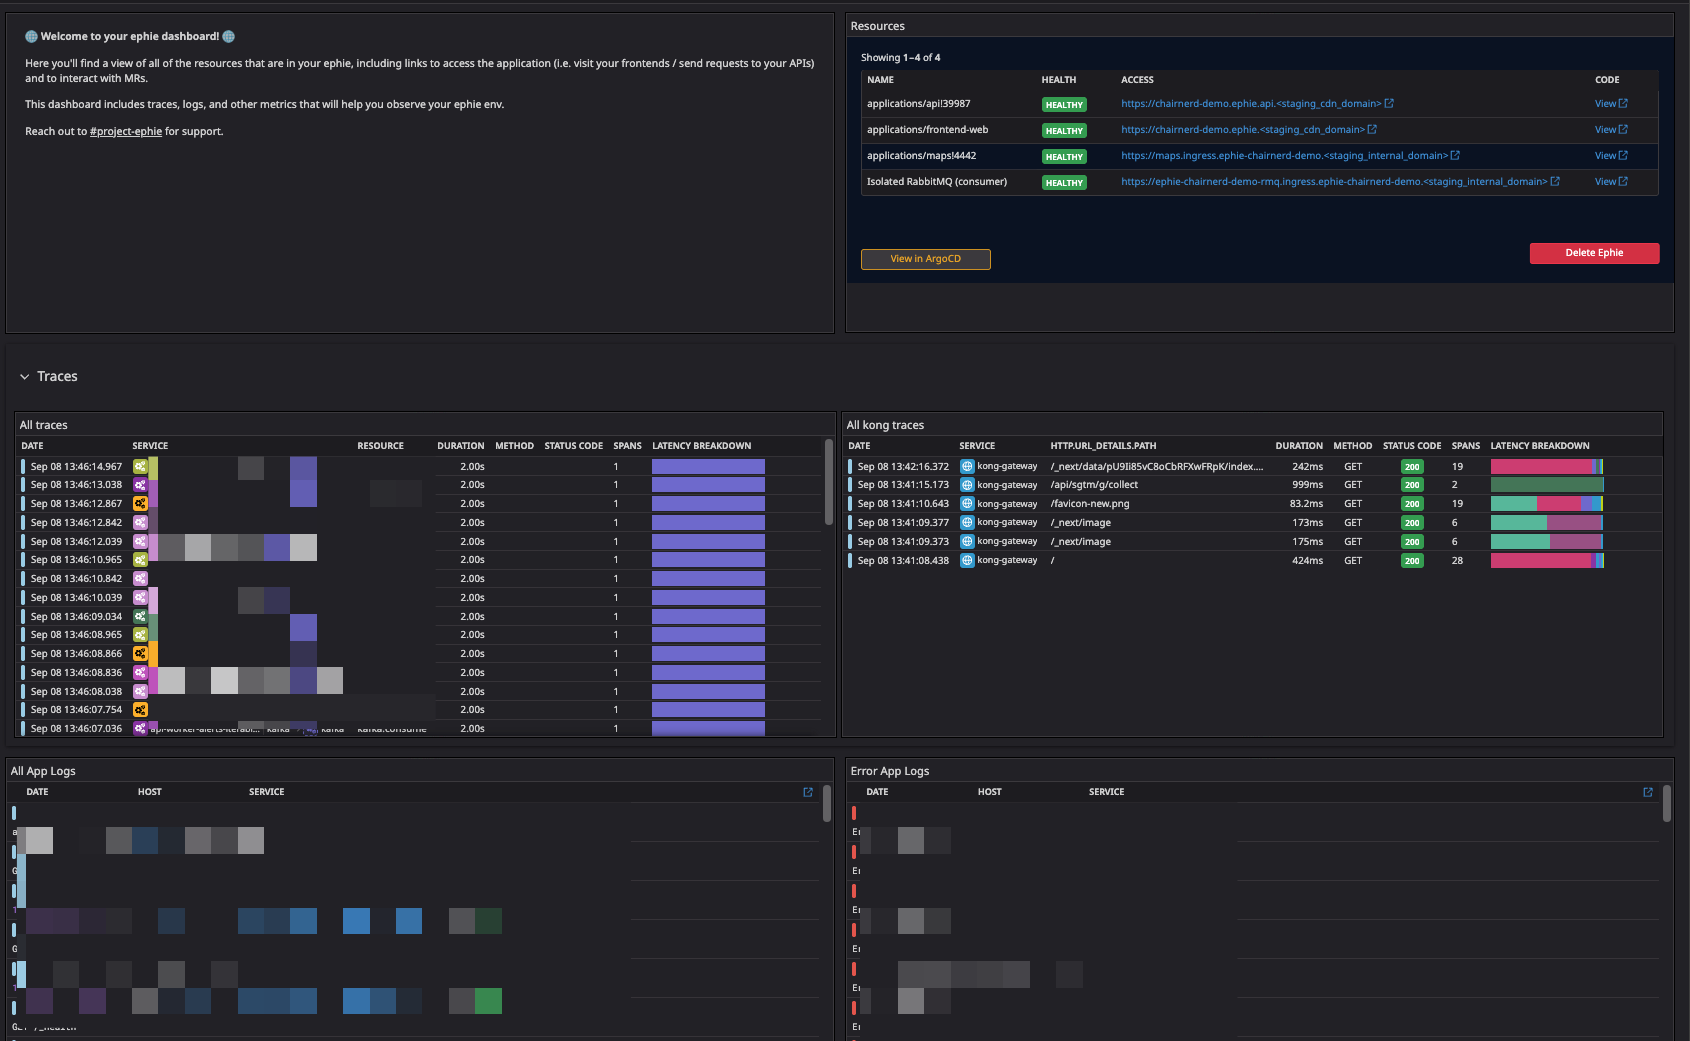
Now I am ready to test. And I didn’t need to remember any complex commands, or know so much about all of the repositories in the SeatGeek landscape, or be a Datadog expert to find the traces associated with my application to do so.
How it works
Ephie is powered, on the backend, by a top-level EphieEnvironment CRD and operator as well as sub-operators for specific, composable resources within the environment. (We use reddit/achilles-sdk as our underlying controller framework.) An example ephie environment is submitted to kubernetes from the client as such (simplified):
1 2 3 4 5 6 7 8 9 10 11 12 13 14 15 16 17 18 19 20 21 22 23 24 25 26 | |
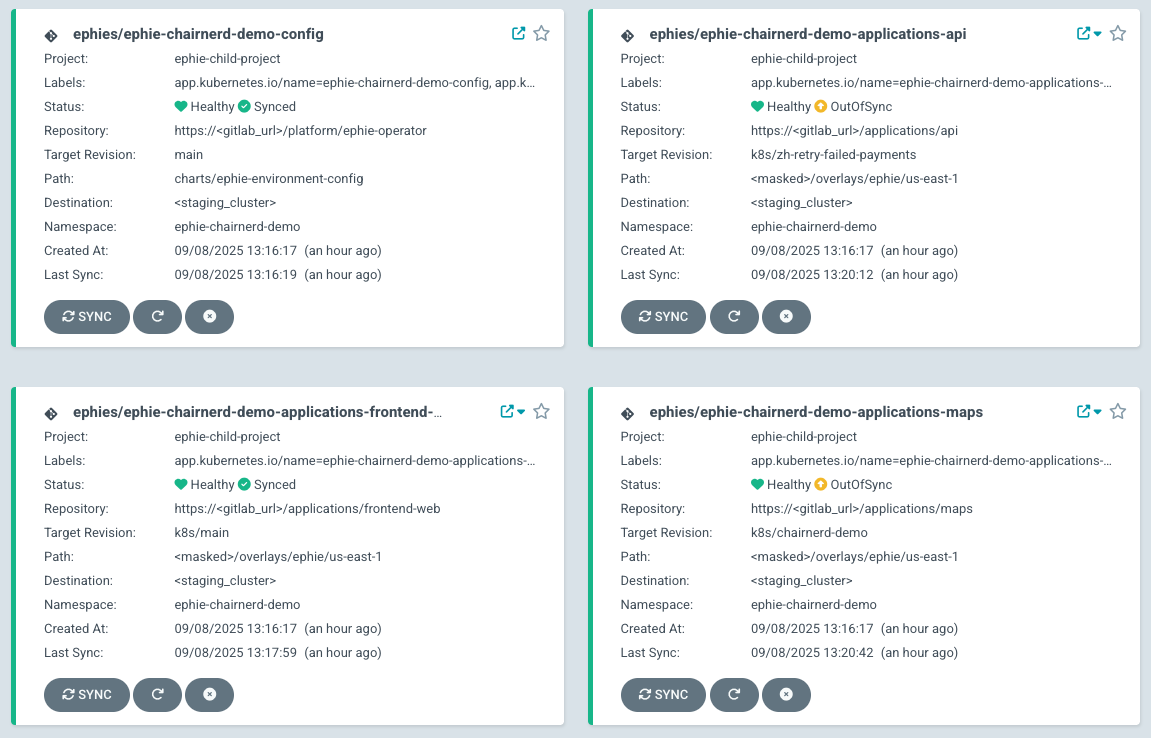
The operator will, from this initial CRD, create ephemeral ArgoCD applications for our applications/api, applications/maps and applications/frontend-web applications and create an IsolatedRabbitMq CRD which will be reconciled by a child operator to create an ephemeral RabbitMQ broker running inside an ArgoCD application, as well as inject credentials for that broker into all applications running in our environment.
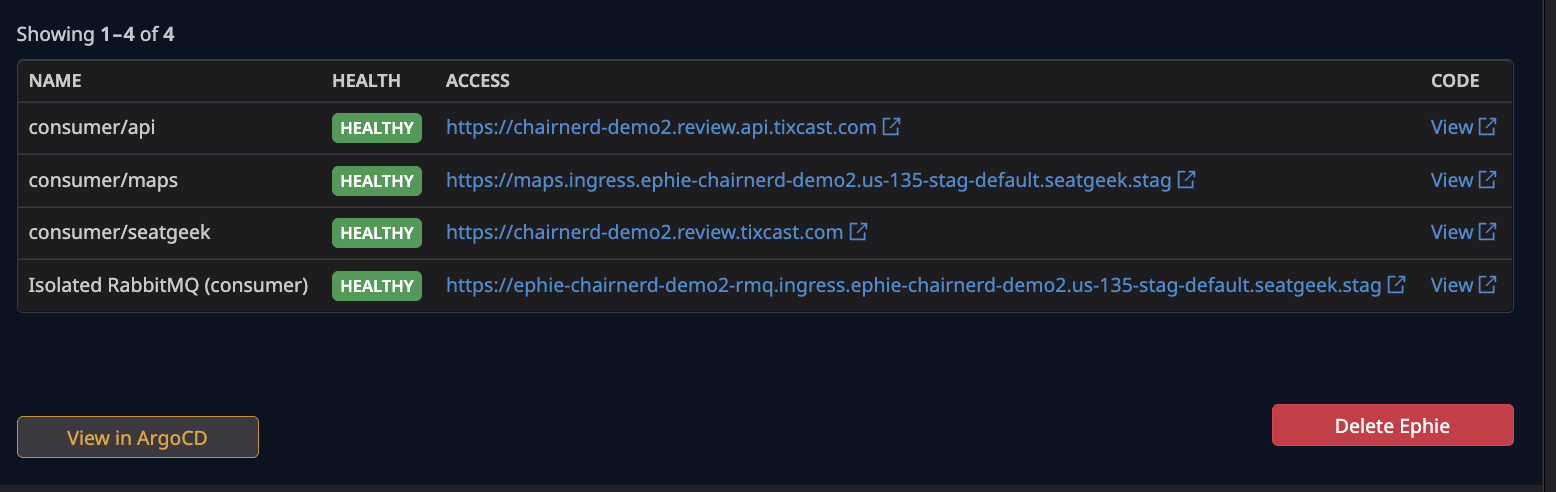
The operator will also monitor the health of its resources, which will be written into its status field, giving clients an up-to-date reference for health of and links to all parts of a user’s ephie.
1 2 3 4 5 6 7 8 9 10 11 12 13 14 15 16 17 18 19 20 21 22 23 24 25 26 27 28 29 30 31 | |
As an added bonus, building the ephie backend on top of an enriched CRD makes it easy to build out new integrations and experiment with different user interfaces. For example, we built an experimental Datadog App Builder view that shows users a lightweight, interactive overview of their ephie from within their customized dashboard.
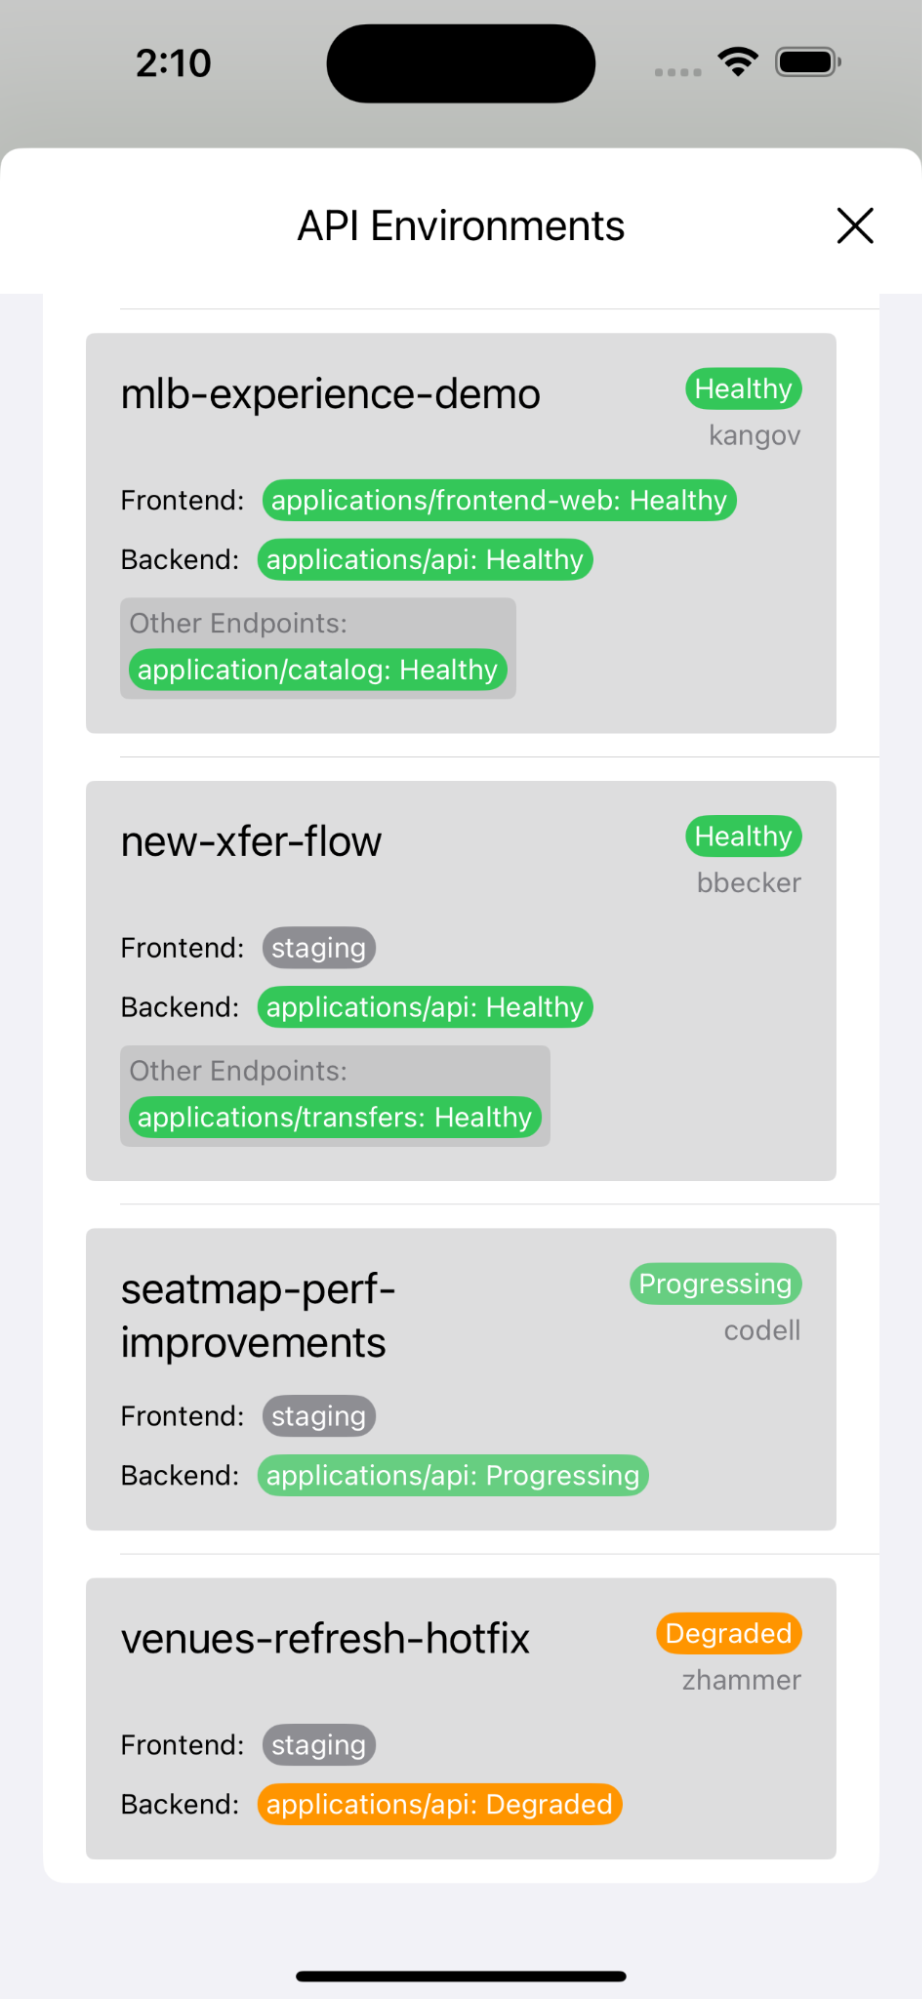
And our mobile team was able to use the CRD API (exposed via a REST adapter) to create an easy-to-use view of available ephies for iOS testing. (Once an ephie is selected, relevant application URLs are overridden in the developer’s mobile app.)
Isolation & Interconnectivity
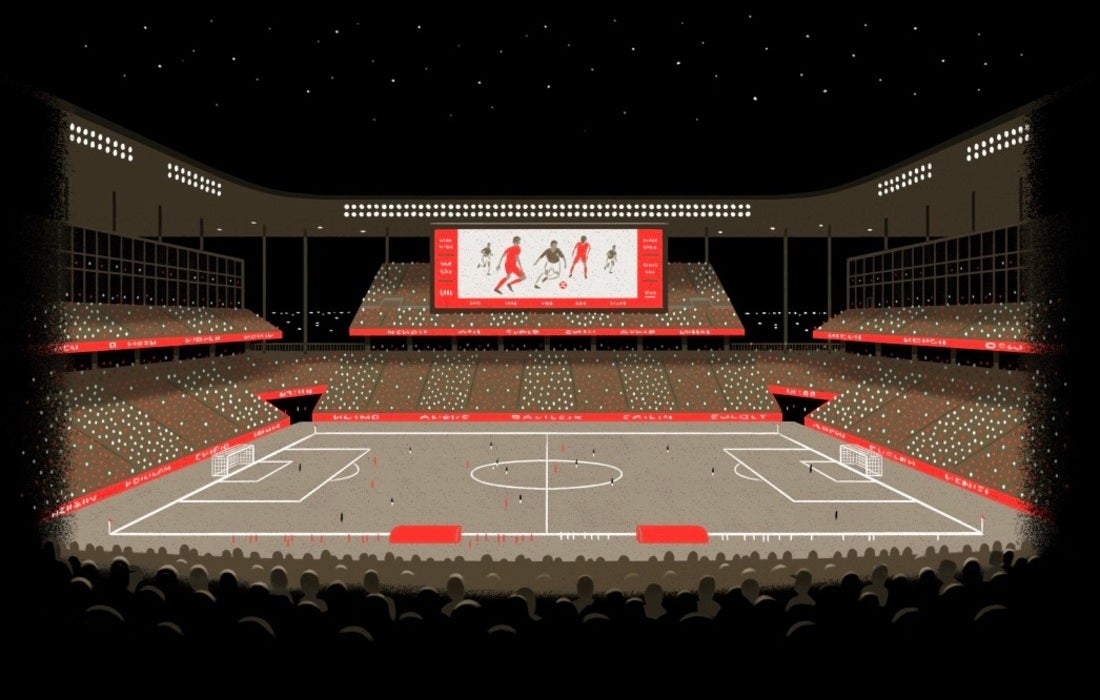
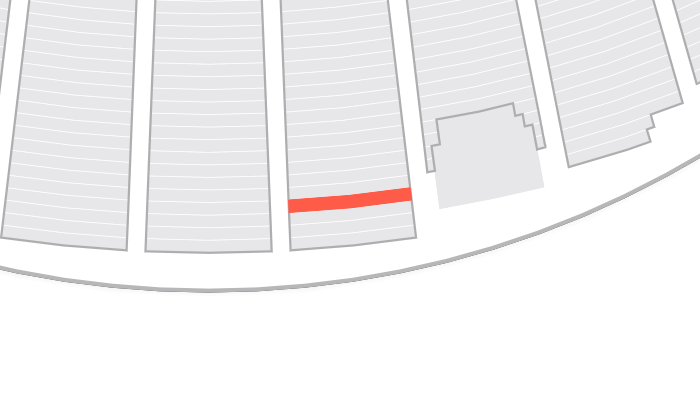
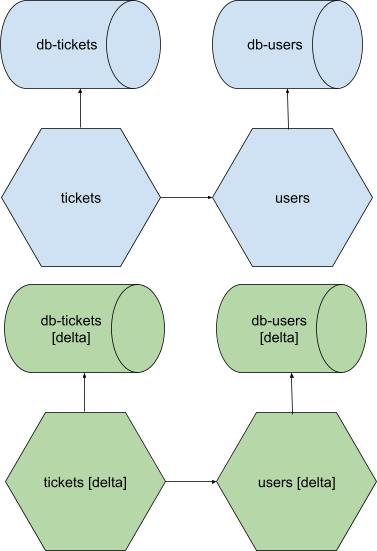
The constellation of applications (and resources) within an ephie exists as a semi-isolated overlay that rests atop, and reaches into our foundational stable staging environment. So if this is our general, multi-application environment:
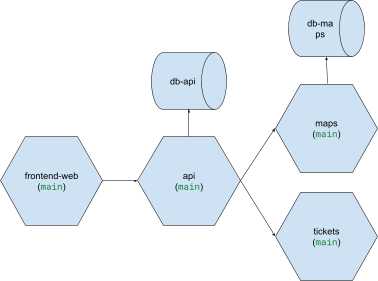
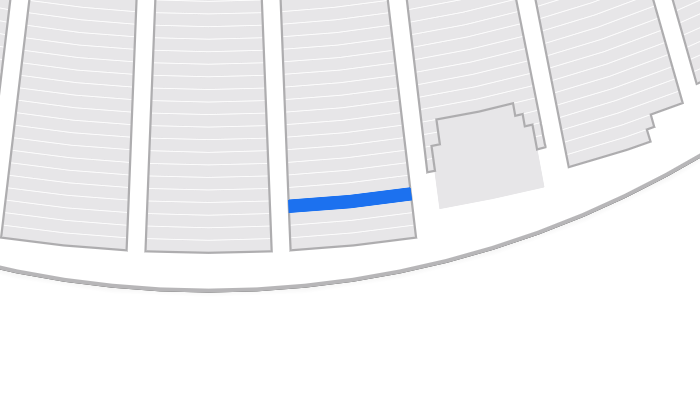
And I create an ephie with the frontend-web, api and maps applications, as well as an ephemeral db-tickets database, I will have an overlay which looks like this:
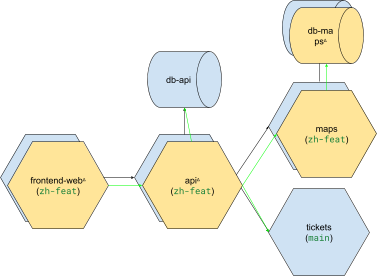
Here, I have my delta deployments of frontend-web, api, maps, and maps-db, which, when they call out to applications of those names, reach their isolated counterparts, but which, when they call out to, for instance, tickets, or db-api, fall back to the versions of those applications/resources that exist in the stable staging environment. If tickets, of the stable staging environment, on the other hand, sends an http request to api, it speaks to the api that is in the stable staging environment, not our isolated overlay.
The applications, and ephemeral resources, in our ephie overlay live in a unique namespace within our staging cluster. (ephie-chairnerd-demo-config houses some of our shared resources, such as our ephemeral RabbitMQ.)
They’re deployed using a special ephie/ kustomize overlay which adds some basic, global overrides, such as disabling canaries and setting replica count to 1 for quick Deployment startup. If asynchronous resources are not isolated, replica counts for asynchronous workers (as specified in their manifests by an annotation) are set to 0. Otherwise many different simultaneous deployments of a worker would contend for events emitted by shared staging message brokers. If asynchronous, or other, resources are isolated, the connection strings for those ephemeral resources are injected into a file which is sourced into the environment (last, after all other environment variables are sourced) by our entrypoint script.
For service-to-service HTTP communication, we have a homegrown configuration using our Cilium service mesh in which DNS requests emanating from a pod will first search for their target Service within their own namespace (the namespace of the ephie environment), and, if that fails, fall back to the mesh which directs the request to the Service within the stable staging environment. The simplified configuration looks like this:
1 2 3 4 | |
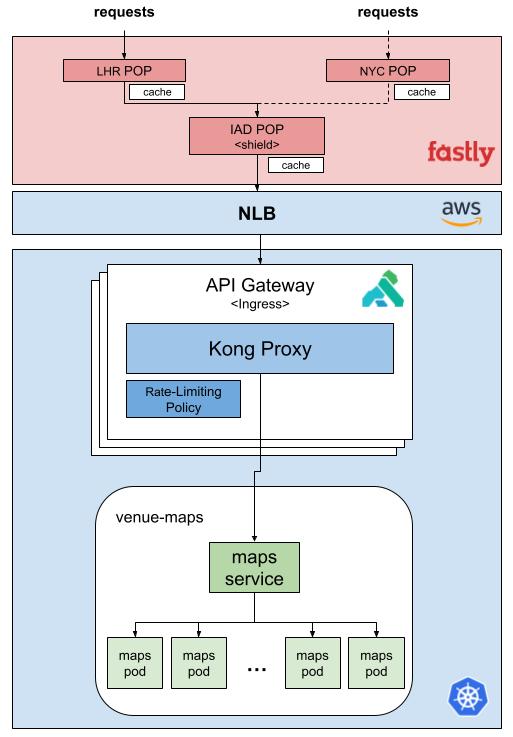
For applications which rely on ingress through our CDN (Fastly) we have additional configuration, managed via Kong and Fastly VCL, which provisions a simple, easy-to-remember URL that engineers and stakeholders can use to access the user-facing applications with the same rules as our staging ingress.
Ephemeral Databases
We provide ephemeral Postgres databases for ephie environments under limited use cases. (As noted above, we haven’t yet seen enough demand for globally available one-off ephemeral databases to warrant the effort required to solve sticky problems that arise from mixing ephemeral and non-ephemeral databases within one environment. Our top concern in building ephie is to prevent cross-contamination into our “stable” staging environment; inconsistent data across related databases threatens that.)
To provide ephemeral RabbitMQ brokers, we were able to easily offload a simple configuration within our top-level CRD to the rabbitmq/cluster-operator, have that create a new cluster from scratch, and then run a script to copy queue definitions from a specified cluster running in AWS’ AMQ. The cluster requires relatively little resource to run and is quick to start up.
Spinning up an entire ephemeral Postgres database, on the other hand, is complex. First of all, these DBs are large: for our most-used ephemeral database, we allocate 100Gi storage space. Second of all, the startup migrations required to load a functional dataset into our database are lengthy and threaten quick startup time for ephie environments. (Other components of the database are fairly straightforward, like for the RabbitMQ brokers. We allow for some postInit statements in the CRD that are run after startup, and inject the DSN into our application’s environments for connection.)
We use the CloudNativePG operator for managing the lifecycle of Postgres DBs in our ephie environments. Every week, eligible database from our shared staging environment (which run on RDS) are pg_dumped into corresponding CNPG Clusters. From each Cluster (a running copy of the shared RDS database in k8s), we take a VolumeSnapshot which becomes the source from which we restore new ephemeral versions of the database for users. (We delete this VolumeSnapshot once the next week’s snapshot is created, keeping costs low.) While the RDS->Cluster restore which runs on the weekend may be long and slow, a user who requests a new database for their environment gets it on-demand, with sub-minute startup time, via a restore directly from the volume.
Looking forward
Ephie has been incredibly well-received by our engineers. While embarking on a long, multi-increment endeavor can be daunting, doing so in close contact with Product and other non-Platform customer teams makes for a successful feedback loop, one in which partner teams will advocate for investment, and larger groups of engineers will have exciting moments in which they see core features of the project they have been following or ideating on in interviews come to life. The overflow of support from our users has likewise been great for the engineers on our team. There is no better way to encourage a product-first mindset in Platform engineers than letting them feel the joy of delighting their peers and seeing the real appreciation for their work.
At the time of this post, we have 75 monthly active users and 70 ephies currently bopping around in our staging environment, with an average startup time of just over 3 minutes.
The composable nature of ephie (child operators, extensible CRD API) leaves open vast possibility for where we can take ephie in the future. Ideas range from simple integrations, like adding more isolatable resources (datastores, environment variables, feature flag configurations), to more complex initiatives, like creating prod-like environments for perf testing or further shifting left the test environment so that resources can be quickly spun up and torn down on a developer’s machine. Of course, if there is interest, we would be excited to genericize and open source what we have built as well!