Last week we launched a feature that even the most die-hard SeatGeek fans probably didn’t notice. However, we think that this feature makes a huge difference in usability and overall user experience, even if only at a subconscious level. You can now interact with the section and row shapes themselves, rather than just section/row markers.
For anyone not familar with our maps, here is an example of what one looks like:

Each of those markers represents a ticket or a group of tickets in that section. Until recently, all of the map interactions revolved around those markers. In order to find out more about the tickets in a section or row, the user would have to hover or click on the marker itself.
Fitts’s Law
One major concept in human-computer interaction is Fitts’s Law. Fitts’s law models the time it takes for a user to move a pointing device (e.g. cursor) over an object. In order to decrease the time to select an object, one can do one of two things: decrease the distance between the cursor and the object, or increase the size of the object. On SeatGeek’s maps we are constrained by the layout of venues, so our only option is to increase the marker size.
The natural way to increase the target area of a marker is to expand it to the shape of its section. However, it turns out this isn’t straightforward.
How Our Map Pages Work
First, a little background on how our map pages work. We use an excellent library, Leaflet, as the foundation for our interactive maps. The maps themselves start out as vector files. These are then rasterized into a bunch of tiles, such as this:

Leaflet handles the logic for mouse interactions and displaying the correct tiles depending on the current view. The markers are a custom Leaflet layer (for performance reasons, but that is a whole other blog post). Then, we overlay a vector path as an SVG layer when a marker is either hovered or clicked.

First Attempt at Section Interaction
A while back, when we first implemented our current style of maps, we considered adding polygon interaction instead of just using the markers. Given that we had the SVG paths of all of the shapes for the highlighting purposes, we decided to add all of these SVG elements to the map so that we could use the built-in event handling that browsers provide.
Unfortunately, that resulted in terrible performance on the map page. At the row level, we can have as many as a few thousand SVG elements being drawn at the same time. Combine that with all the markers we have to draw, and the map grinds to a halt. We decided to shelve the section interaction and move on to other features.
A Renewed Attempt
With the launch of our new map design, called the Omnibox, click and hover interactions became much more central to the interface.
The breakthrough was realizing that we could implement our own logic for hit-testing, or checking if a given mouse position is inside of a polygon. This means we didn’t have to add any additional elements to the DOM (like we did before with the SVG elements).
The naive approach would be to iterate through every polygon and check if the mouse is inside it using the ray casting algorithm.
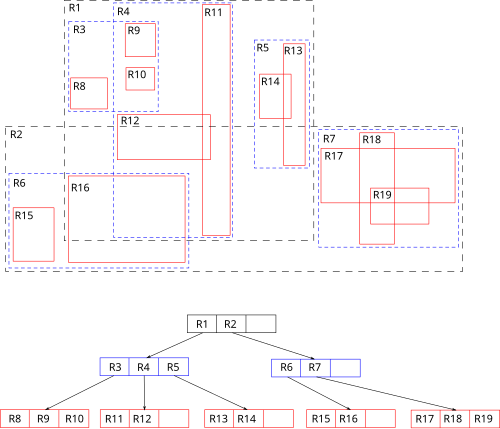
However, we can do even better. By using a spatial data structure, such as an R-Tree, we can reduce the lookup complexity from linear to logarithmic. Below is an example of a 2D R-Tree. Imagine that the lowest level of the tree contains references to the actual polygons. Each node in the tree represents a bounding box that is the union of all the children below it in the tree.
Luckily enough, we were able to find a leaflet-compatible implementation of an R-Tree by Calvin Metcalf. Basically our use of it looks like this:
- On page load, convert all of the SVG shapes to geoJSON and insert into the R-Tree.
- On mouse events, transform the mouse position to the map coordinate system and make a throttled call to our intersection testing function.
- Call a search on the R-Tree with the transformed position of the mouse.
- The R-Tree will return a list of all the leaves (shapes) whose bounding boxes had been intersected.
- Iterate through the shapes and perform the ray casting algorithm to check for intersection.
- Return the intersected shape.
Results
The user can now hover over any point in the polygon, instead of just the marker! It works on sections:

And it works on rows:

Most importantly, all of this works without any impact on performance.