All ticketing companies have to deal with the uncertainty that surrounds ticket delivery. Different teams, performers and ticket sellers follow different procedures, ship tickets in different ways, and operate at different cadences. This complicated ecosystem results in variable delivery times, making the ticket buying experience more stressful than it has to be.
At SeatGeek, we’ve worked to reduce this uncertainty by building a tool that lets our customers know exactly when to expect their tickets. “Where Are My Tickets?” is the question our users ask more than any other, and by answering it intelligently we make their live event experience as seamless as possible.
When our data science team set about trying to model the complicated and uncertain world of ticket fulfillment, we based our modeling decisions on the sort of answers we wanted to be able to provide. Expected fulfillment times would be nice, but it would be far nicer to know the likelihood of a ticket arriving before an arbitrary time. In other words, we wanted to fit full probability distributions of ticket arrival times, and we wanted these to be available whenever a user reached out.
In the end, quantile regression and tensorflow-serving turned out to be the right tools for our problem, and our problem turned out to be an excellent use case for the tools. Today, our predictions are available at all times to our customer experience specialists. By default, we provide an upper-bound on the delivery time that should be correct 80% of the time.
Quantile Regression
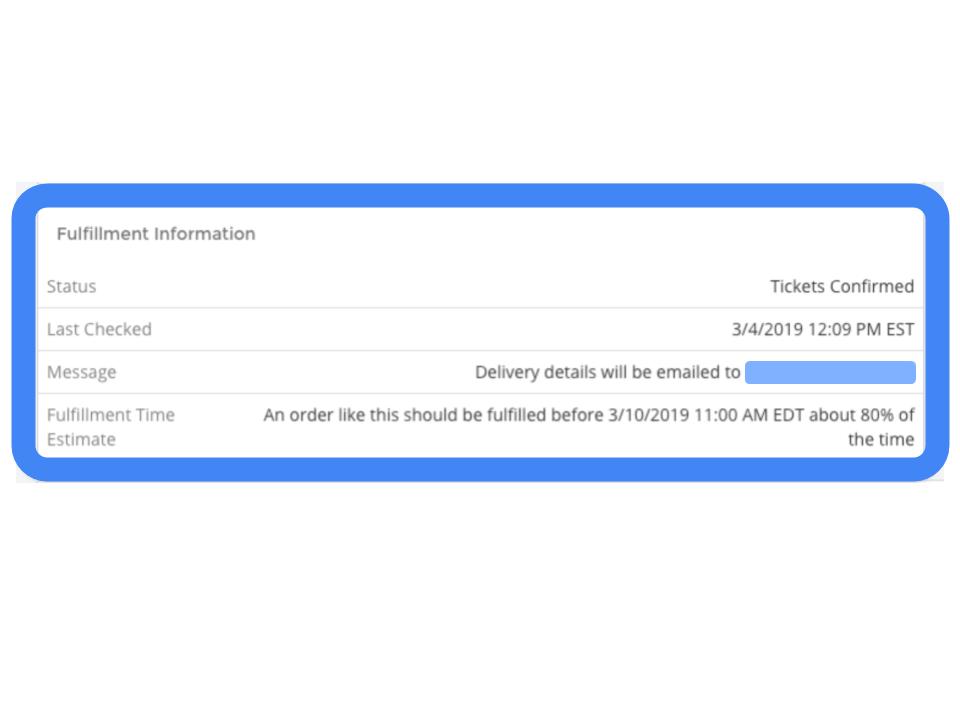
We needed to arrive at a conclusion of the form:
An order like this should be fulfilled before 3/10/2019 11:00 AM EDT about 80% of the time
This would require us to infer a nearly complete probability distribution for the ticket’s fulfillment time.
Quantile Regression lets us do just this. Quantile Regression is a method by which several quantiles of the probability distribution of the response variable are estimated simultaneously, approximating a full distribution. The quantile loss function can be used on linear or tree-based models, but in our case the features showed strong non-linearities and interactions, and a simple neural network outperformed other modeling options.
Using a series of intuitive listing-level features, we architected a network that outputs a set of values per observation, each corresponding to a manually selected quantile (here called target alphas) ranging from 0.005 to 0.995. Together, these quantiles estimate a full distribution.
To interpret our outputs, we need only insert the fitted value and associated target alpha into a sentence of the form shown above:
An order like this should be fulfilled before {datetime} about {target alpha} of the time.
Then if the fitted value for target alpha 0.95 is 3 days, we would say that the order should be fulfilled within 3 days about 95% of the time. We display the predictions associated with the 0.80 target alpha on our customer experience page, as shown above. These quantiles are all learned simultaneously by training the network with the quantile loss function.
Since our model approximates a full probability distribution, we can also fit conditional probability distributions. With these conditional distributions, we can use the fact that an order has not yet been fulfilled to update our estimate of how long fulfillment will take. As time passes, we regenerate upper bounds from the conditional distribution of fulfillment time given the observed period of non-fulfillment, making our outputs even more intuitive.
Sometimes customers contact us before we expect their tickets to be fulfilled. For these tickets, where the time that has elapsed since the order remains less than the expected fulfillment time, our predictions do not change much with time. However, as this time period approaches our expectations, our fulfillment time estimates incorporate this information, raising our upper bounds accordingly.
Here we visualize these updates. Each line is a ticket, and its place on the y-axis is determined by the initial median fulfillment time estimate. The x-axis represents time elapsed since the order was placed. From left to right, we can see the changes in our median estimates.
You may notice that some lines start around the “hour” mark, and then increase after only a few minutes. These represent tickets to which our model fitted a bimodal distribution. While the median was on the order of hours, our model understood that the tickets would either be fulfilled in minutes or days. As soon as it’s clear that the tickets are not going to be delivered right off the bat, our model increases the predictions. There are many possible explanations of bimodality here. Perhaps these are tickets that should be delivered instantly, and any delays likely represent significant problems. No matter the explanation, this would be a difficult situation to capture with an ensemble of mixed models, but it is easily done with quantile regression.
Modeling the actions of hundreds of thousands of unique sellers might at first seem like a daunting task, but our strategy has yielded strong results. We measure success by pairing two metrics, R2 and Coverage Deviation. We use R2 to assess the precision of our median estimates, which can be thought of as point predictions, while Coverage Deviation looks at the fit of the larger distribution. To quantify this, we measure the discrepancies between our manually selected target alphas and the empirical alphas, which are calculated as the rates at which a ticket’s true fulfillment time is less than or equal to the expected alpha quantiles. For example, our second target alpha is 0.05. For each observation, then, the second output of the model is a time estimate that fits into the sentence:
An order like this should be fulfilled before {datetime} about 5% of the time.
We arrive at an out-of-sample empirical alpha by measuring the proportion of observations that had true fulfillment times less than their fitted 0.05 quantile. Our second empirical alpha is 0.0517, for a deviation of 0.0017. Coverage Deviation is the mean deviation across all of our alphas, and our model achieves a Coverage Deviation of 0.004. This confirms that our fitted quantiles mean what we expect them to mean. Pairing this score with an R2 of 0.7, we can be confident that our median estimates capture the likely fulfillment times and our sets of quantiles match the true distributions.
Tensorflow-Serving
Our goal was to provide our fulfillment time upper bound estimates instantaneously to users and customer experience representatives. Quantile regression gave us these estimates, and tensorflow-serving let us deliver them on-demand.
To maintain a web service that can be called by user requests, we need to ensure that requests can be returned within 50ms and that our service is available more than 99.9% of the time. These requirements can be burdensome when deploying predictive services.
The response-time requirement means that we need to carefully consider performance whenever we improve a model, and the uptime requirement can be a burden on our data scientists, who work on a very wide variety of problems and do not always have the bandwidth to monitor web services.
In collaboration with our engineering team, we researched off-the-shelf model servers, hoping to avoid building an entirely custom service. Model servers handle loading models, caching them in memory, and efficiently servicing requests. We gravitated toward tensorflow-serving because tensorflow is a powerful and flexible numerical computing framework, and because we have experience working with tensorflow on other features such as deal score.
We deployed tensorflow-serving in a docker container and pointed it at a neural network of comparable weight to our new model. We then used locust, a load testing tool, to evaluate the performance of this service and found that on our infrastructure it could handle about 400 requests per second, with the 99th percentile of response times at about 10 ms. Tensorflow-serving also scales horizontally, so we can always spin up more tensorflow-serving containers to handle a higher rate of requests.
Our final ecosystem looks something like this:
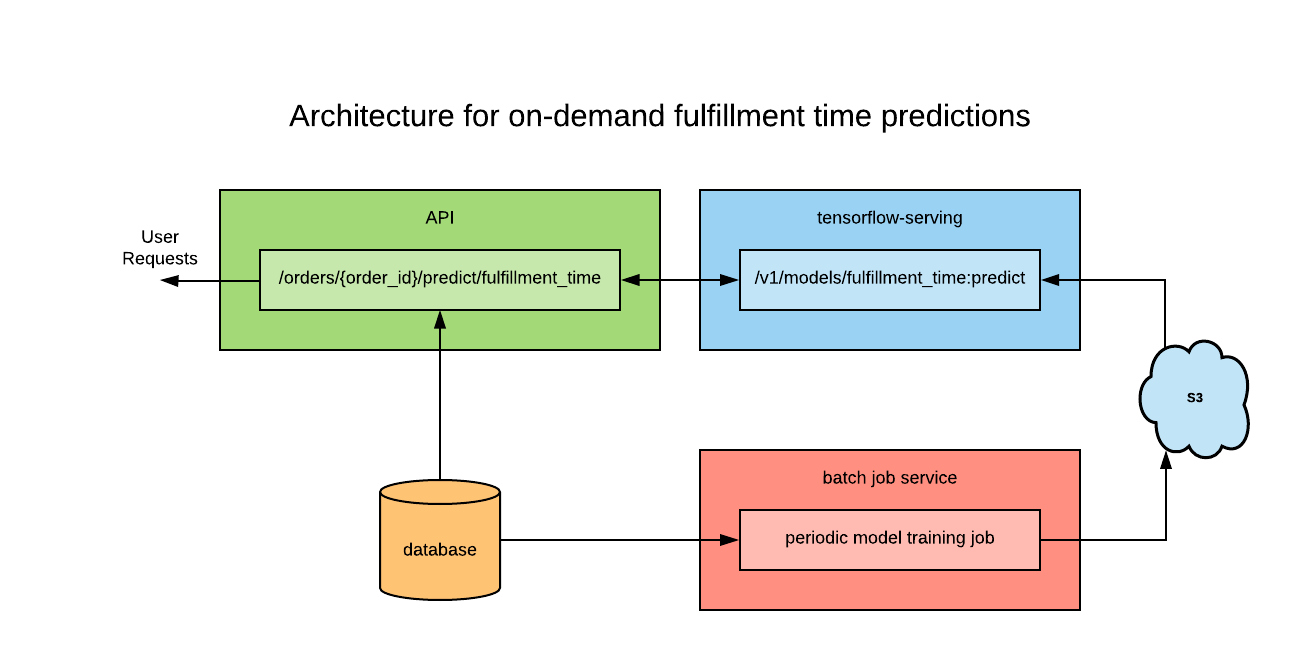
A batch-job periodically retrains our fulfillment time model and stores the resulting computation graph in S3. Tensorflow-serving watches for new model versions to appear in the bucket, and caches them as they arrive. An API endpoint was made to retrieve information associated with a given order and request fulfillment time distributions from tensorflow-serving. This architecture ensures that only the endpoint needs to access the features of a given order, making the whole process very convenient for anyone seeking to access predictions.
Customer Benefit
Currently, these predictions are available in real time to our customer experience specialists on their order information page (see screenshot above), and they us respond confidently to the “Where Are My Tickets?” queries that we receive. Our simple architecture also allows us to work toward exposing these predictions directly to our users, anticipating the questions before they even need to be asked.
Just by looking at the volume of inquiries we respond to, we know that uncertain fulfillment times add anxiety to the ticket buying and event attendance experience. In this instance, we found patterns in historical fulfillment times that could help alleviate that anxiety.
With quantile regression, we arrive at upper-bound delivery time estimates with granular levels of confidence, crafting exactly the sort of responses we find most comforting. With tensorflow-serving we make these predictions available to everyone seamlessly, reducing a major source of uncertainty in our users’ experience.