At SeatGeek, we think about our venue maps as “maps” rather than “seating charts.” Therefore, we aim to make our venue maps as good as the best interactive geographic maps in the industry, such as those by Google and Mapbox.
As part of this aim, we recently made a major change to our venue maps on our web platforms. We now render a vast majority of our maps client-side using vector tiles and Mapbox GL. This is the first major user-facing change stemming from our GIS pipeline and opens the door for some really cool things to come.
Background
For those not familiar with modern web maps, it may be helpful to take a step back and define some concepts. There are two primary ways in which to define images in computer graphics: raster and vector.
Raster Graphics
In raster graphics, images are defined using a rectangular grid of pixels. Pixels are samples of a source image, typically represented by red, green, and blue values. Some common raster file formats include JPEG, TIFF, PNG, etc., with the primary distinguishing feature being the particular flavor of lossy or lossless compression involved.
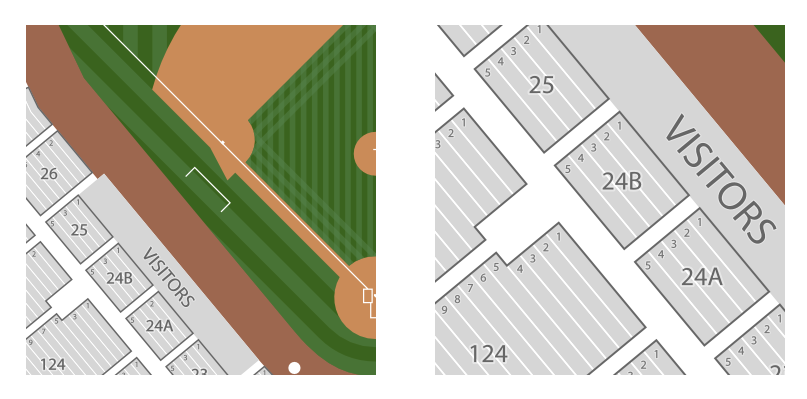
Due to the fact that these images are based on pixels, they are resolution-dependent. Therefore, an image created at a particular resolution only looks correct at that resolution. Displayed at any other size, the image must be resampled. Through this process, things like diagonal lines in the source image can appear as “staircases” or “jaggies” in an enlarged image. Real life is not like CSI; you can only “enhance” a raster image so much.
![]()
Vector Graphics
Unlike raster graphics, vector graphics don’t store information for every pixel of the image. Rather, vector images are defined using higher-level primitives, such as polygons, bezier curves, and ellipses. Due to this, vector graphics are not resolution-dependent; they can be accurately rendered at any scale, regardless of the rendering device resolution. Common vector file types include EPS, AI, and SVG.
![]()
For many graphics, vector representations are substantially smaller files, since they do not store the color value of each pixel. As you can see with the SeatGeek logo, a shape can be defined by just a few nodes and control points. Vector graphics are particularly useful for images which are composed of well defined geometric shapes and curves, such as fonts, logos, and maps.
Raster Maps
Until just a few years ago, almost all web-based maps employed the same strategy: displaying a specific area and zoom level of a map using a collection of raster image tiles (e.g. 256px PNGs). Tiles are particularly useful at producing the effect of a very large, interactive image on the client while being highly cacheable.
However, raster tiles have some downsides. Probably the most noticeable to the end user is that the tiles only exist at integer zoom levels. This means that any zoom action results in a “jump” between different zoom levels. Many libraries cover this using CSS transformations, scaling up the lower resolution tiles and replacing them with the higher resolution tiles as they load.

Additionally, because the tiles are rendered on the server, there is no way to manipulate or style the map on the client without using overlays, like we did with canvas tiles.
Vector Maps
Unlike raster maps, vector maps are rendered entirely by the client. Although they use the same tiling strategy as raster maps, these tiles only store geometries and metadata. The client-side renderer (Mapbox GL) takes the data from the tiles and style definitions and draws maps at a very high frame rate.

Even though vector tiles are also only defined at integer zoom levels, the renderer can render any zoom level. This means we can initialize our venue maps to be the perfect size for every screen and give the user an incredibly smooth experience.

In web apps, vector maps have only become practical in the last few years. For any moderately complex map to render at 60FPS, the renderer needs to be WebGL-based. WebGL permits the use of shader code in order to take advantage of dedicated GPUs, which are able to draw scenes much more efficently than any CPU-executed JavaScript. Unfortunately, it has taken a while for WebGL to reach a vast majority of users’ browsers. As recently as 2012, the only major offering of vector maps was Apple Maps, and that was only offered in native applications.
Thankfully, we have seen tremendous growth in WebGL support in the last couple of years. According to our tracking, over 95% of our visitors have a WebGL enabled browsers. Only for a sliver of traffic and a small number of older maps do we fall back to our Leaflet.js raster maps.
Next Steps
One of the major reasons we chose Mapbox GL is because of its cross platform support and we are actively working on bringing vector maps to our native applications.
Additionally, some of the design and UI decisions we made were reflections of the limitations of our legacy mapping stack. Now that we have the ability to fully access and manipulate the map data on the client, we are free to completely rethink how our maps work.
Final Thoughts
First of all, we want to give a shout-out to Mapbox. Our maps have benefited greatly from their open source work. They set a great example of how companies can contribute to the tech community and have been an inspiration for our efforts to do more of the same.
Finally, if these are the types of projects that excite you, come work with us!