Having a lot of data can be both a blessing and a curse. It’s wonderful to have data, but managing it well can be a headache. Here at SeatGeek, our data come from a variety of sources in a variety of formats, and these aren’t always accessible or easily analyzed in their original form. On a daily basis, we use ElasticSearch, MySQL, Redis, and S3 to handle and store major parts of our data. We have a lot of internal services that process and output data in different ways, and we also rely on external data sources like Google Analytics and various partner APIs.
The problem: data accessibility
Many of the wider-scale business questions we’re interested in require that we look across all this data at the same time, which can be painful to do when these data sources aren’t smoothly integrated. In the past couple of months we started attacking this data underutilization problem in earnest by investing a good bit of time in building out our data architecture with a shiny new pipeline and data warehouse.
Some backstory for this: we use MySQL as our main production datastore, and up until our revamp this datastore supported most of our analysis as well (ouch). Expectedly, we faced a host of recurring issues that paved the path for us to finally pull the trigger on this project. All these problems could be grouped under a common data accessibility theme, in a couple of different ways:
- The data isn’t there
- Most of our important data is in MySQL of course, but we have a lot of goodies in ElasticSearch, S3, etc. that for all analytics intents and purposes were gathering dust. A great example is Sixpack, our Redis-backed A/B testing framework
- The data is there but isn’t formatted well
- Data formatted to be easy for the app to process but is awkward to analyze (EX: key-value blobs), data baggage - legacy naming conventions that no longer make sense, etc.
- The data is there but isn’t organized well
- Separate tables that should be one, huge tables that we can’t feasibly use because MySQL isn’t optimized for analytical queries
- The data is too accessible! (We just can’t win)
- When interns are running queries against the production DB1, it’s time to make a few changes…
The solution: Looker, Redshift, and Luigi
Looker: Looker is a BI service that hooks on top of your datastore with its own data-modeling language to provide a nifty frontend layer to the data. We actually were interested in using Looker way before we started revamping our data stack, but when the first complex query we tried in MySQL took 20 minutes to return, it was essentially the last straw.
Most of our crew here is pretty SQL-savvy, but when many queries are being run daily to return summary stats, it’s useful to have those results automatically pop up in a digestible and visually pleasing way. Additionally, some of those queries contain complex business calculations, and when needing answer one-off questions or investigate a certain window of time, it’s handy to have that all consistently defined and saved. As an example of the neat visual insight a Look can provide, here’s a map of clicks on Super Bowl tickets since the end of the championship games showing the localization due to team and venue:

Redshift: Redshift is Amazon’s cloud-based analytical datastore, a columnar datastore based on PostgreSQL. A main benefit of columnar datastores is that column-stored data is far more optimized for the ‘many rows, few columns’ summary queries that analysts are interested in running than is row-stored data (the 20-minute query above took maybe half a minute in Redshift).
Why Redshift in particular? The choice was simple as we already use many of Amazon’s services, and Redshift is straightforward to set up and scale. Some of our own data services already write directly to S3, and it’s extremely easy to load data into Redshift from S3. We can also easily loop EMR, Amazon’s map reduce service, into our data pipeline.
A lot of best practices are well documented in Amazon’s Redshift user manual, so you can easily get up and running with settings already tuned for query speed. For instance, distribution keys collocate tables that are commonly joined together; sort keys identify columns that tables are most often ordered by. Admittedly, a lot of these options are simple, and Redshift lacks a lot of PostgreSQL features that allow for more advanced customization and data processing. Fortunately, we’ve been able to work around this using Luigi.
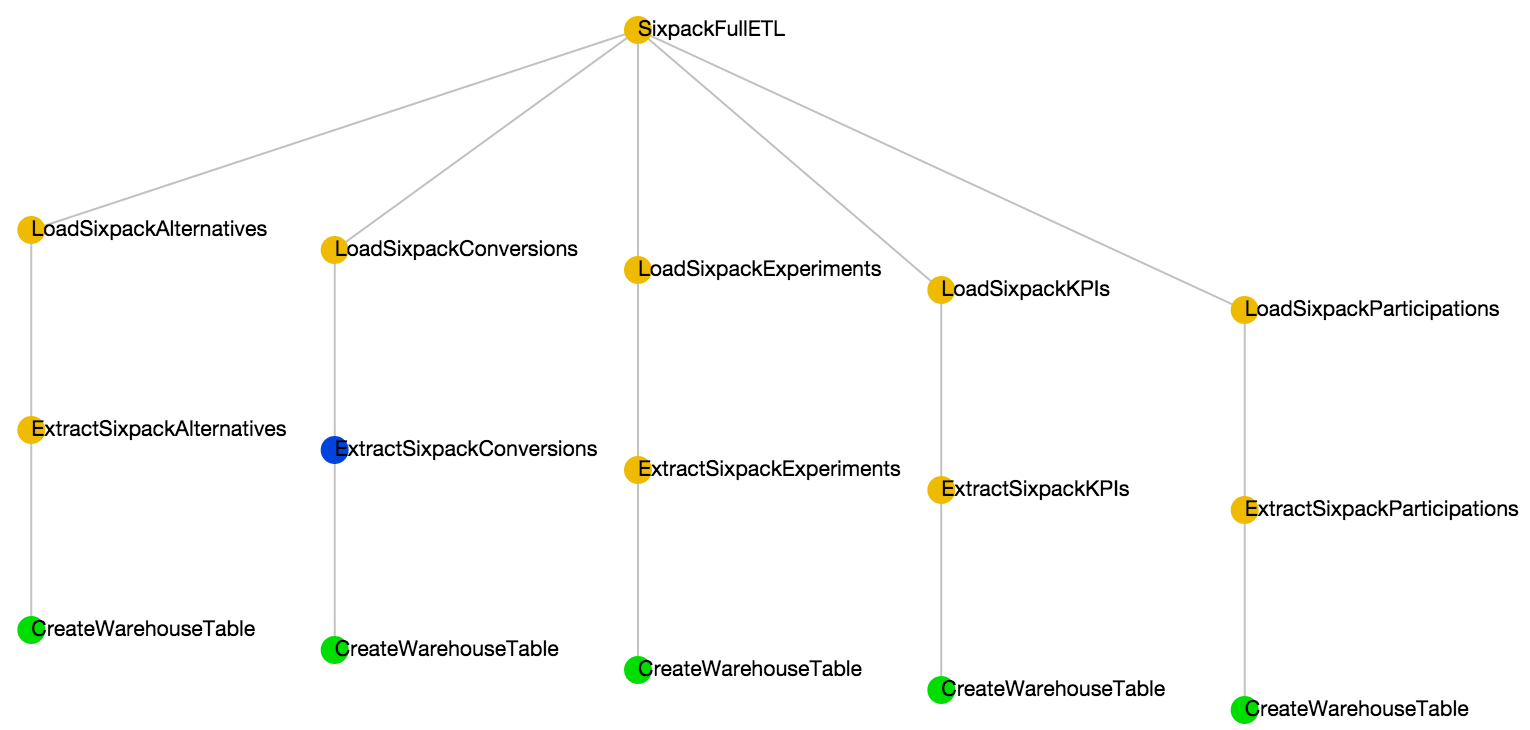
Luigi: Luigi is an open source Python framework created by Spotify for managing data processing jobs. One thing Luigi is really great at is dependency management, which makes it a perfect tool for coalescing together data sources that depend on each other. As stated in its docs, Luigi does not manage time scheduling for tasks. We use our own cron-like service for kicking off a single Luigi task that encapsulates the entire ETL process every night. The dependency chain automatically schedules every incomplete task under that ETL process. This works great for scheduling tasks with simple hierarchies:
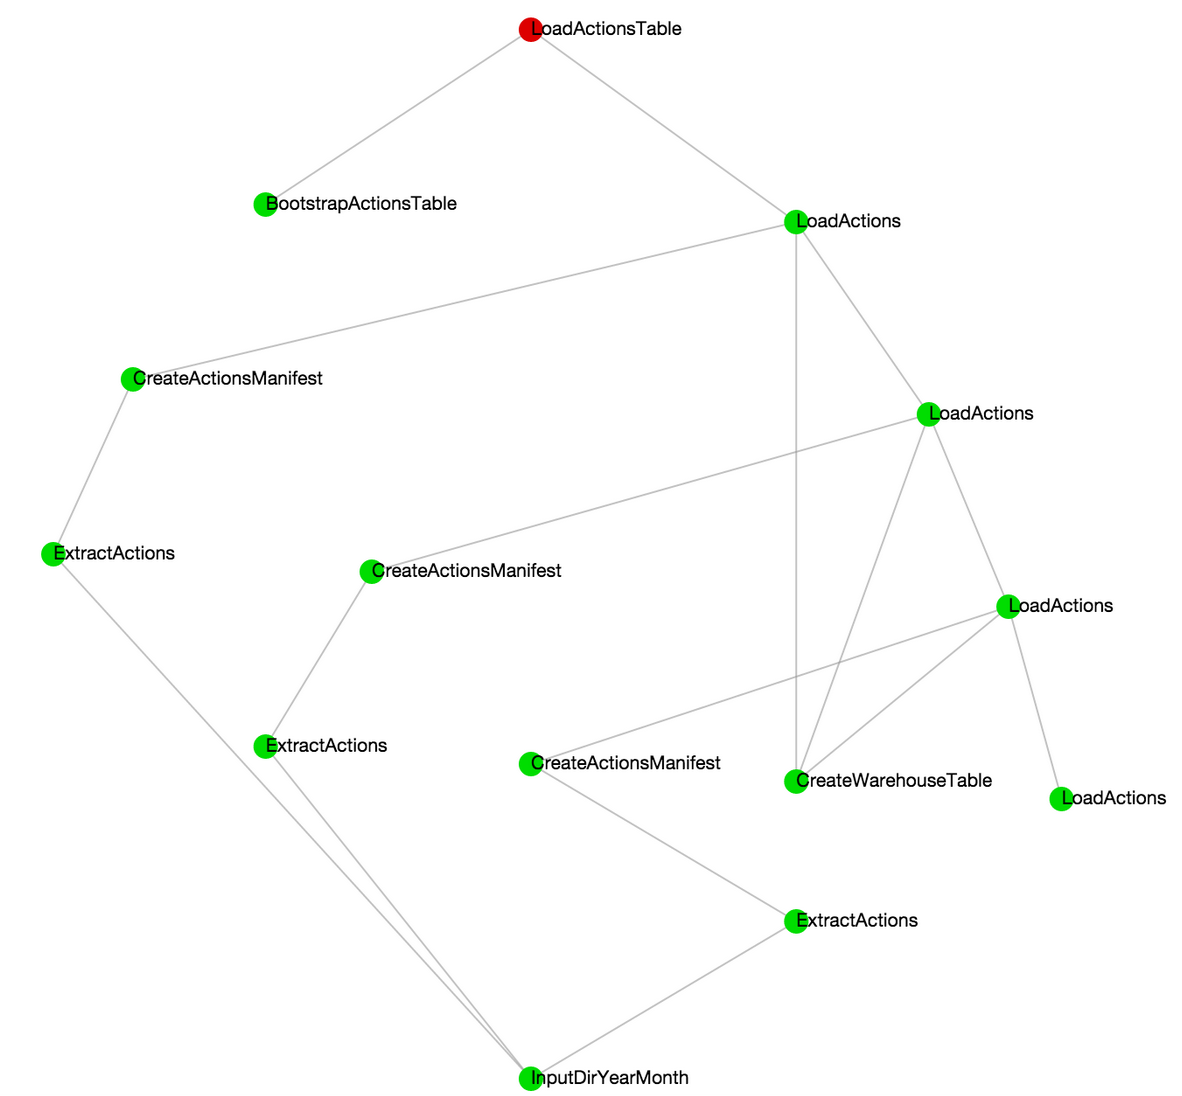
But it also works just as well for tasks with more gnarly dependencies:
We’re happy with some of the basic patterns for ETL tasks we’ve settled on. We wrote our own ETL base classes on top of Luigi’s Task and Target objects that we subclass and customize for our various data sources, as well as helper tasks and targets for working within Redshift and S3. The data-loading method that we’re sticking with currently is to have transformed data written to S3 files and then loaded directly into Redshift tables using Redshift’s manifest files and COPY command. This makes it easy to standardize the data loading process across different sources since most of the customized logic will be written in the extraction / transformation steps. (Side note: for our MySQL data we do things slightly differently; we load the tables exactly as they are into Redshift first before applying any transformations in order to minimize contact with production data).
Luigi’s flexibility makes it easy to fill in the gaps caused by Redshift’s lack of SQL feature parity with PostgreSQL, as well as extend the data pipeline beyond just ETL tasks. As a simple example, it’s common to create something like a date dimension table using a stored SQL procedure, which Redshift doesn’t support. It’s easy to code that date logic in Python though, and encapsulate it within a Luigi task. In this case, rather than extracting from a remote datastore, we just “extract” dates from the calendar and “transform” them into dictionary elements. We can use a (very) simple generator to create these rows:
1 2 3 4 5 6 7 8 9 10 11 12 13 14 15 16 17 18 | |
Then it gets fun! ExtractDateTable inherits “output” from BaseExtractor, which has an abstraction allowing us to write to an atomic manifest of CSV files on S3, ready for loading into a Redshift table.
1 2 3 4 5 6 7 8 9 10 11 12 | |
Using the dependency management provided by Luigi, not only does our BaseLoader know to wait for success of the “Extract” task, but it also knows that the output of ExtractDateTable is the appropriate file to COPY to the data warehouse and that all files can be deleted from S3 as soon as they arrive in Redshift.
1 2 3 4 5 6 7 8 9 | |
This might seem a bit heavyweight for a static table, but with a few key abstractions, creating a new table in our data warehouse has become as simple as writing a Python2 script that outputs a CSV file. Some of this Luigi monkey patching was borne out of necessity, but we actually prefer doing it this way now because it bestows some great benefits. We find it makes it easier to triage data issues when all our data transformations are recorded in a single location and version-controlled, and very powerful to be able to transform our data in any way that’s expressible in Python. Data science at SeatGeek has long involved writing Python scripts that output large CSV files. Having the ability to plug them into a lightning-fast database and an interactive visualization tool? We love it.
‘Looking’ ahead
Since we’re just getting up and running with Looker now, we haven’t been able to play around and explore it fully just yet, but there is definitely more to come. With our basic infrastructure set up though, we’re excited to dig in deeper with our new tools and flesh out our data architecture even further over the next couple of months. If you’re interested in being a part of the journey, we’re hiring data scientists and more!